What Is a Drought?
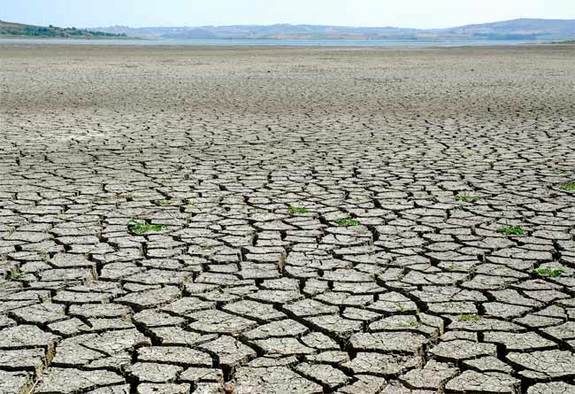
Droughts occur in nearly all types of climate. Of all the weather-related phenomena that can cause severe economic impacts in the United States, droughts come in second only to hurricanes, according to the National Climatic Data Center. But unlike hurricanes, which are easily identified and straightforward to classify in terms of wind speeds, droughts are much tougher to define.
Definition of drought
Most people think of a drought as a period of unusually dry weather that persists long enough to cause problems such as crop damage and water supply shortages. But because dry conditions develop for different reasons, there is more than one definition of drought.
"Drought is caused by not only lack of precipitation and high temperatures but by overuse and overpopulation," said David Miskus, a drought expert and meteorologist at the National Oceanic and Atmospheric Administration's (NOAA) Climate Prediction Center.
In the 1980s, two researchers uncovered more than 150 published definitions of drought which they published in the journal Water International. In an effort to bring some order to measuring drought, the scientists grouped the definitions into four basic categories: meteorological, hydrological, agricultural and socioeconomic. The first three descriptions track drought as a physical phenomenon. The last category deals with drought as a supply-and-demand problem, through the impacts of water shortfalls.
These definitions usually specify the beginning, end and degree of severity of drought by comparing the precipitation over a certain time period to a historical average. Scientists include both rain and snow in precipitation measurements, because some U.S. regions, such as the mountainous West, rely on winter snow for much of their yearly water.
Here are descriptions of the four main categories of drought:
Meteorological drought is specific to different regions, depending on the amount of yearly precipitation that's average for that area. For example, the southwest portion of the United States averages less than 3 inches (7.6 centimeters) of precipitation per year, while the Northwest gets more than 150 inches (381 cm) per year, according to the U.S. Department of Interior. A decrease in precipitation compared to the historical average for that area would qualify as a meteorological drought.
Agricultural drought accounts for the water needs of crops during different growing stages. For instance, not enough moisture at planting time may hinder germination, leading to low plant populations and a reduction in yield.
Hydrological drought refers to persistently low water volumes in streams, rivers and reservoirs. Human activities, such as drawdown of reservoirs, can worsen hydrological droughts. Hydrological drought is often linked with meteorological droughts.
Socioeconomic drought occurs when the demand for water exceeds the supply. Examples of this kind of drought include too much irrigation or when low river flow forces hydroelectric power plant operators to reduce energy production.
Tracking drought
In the United States, the Palmer Drought Severity Index (PDSI, weekly index from CPC shown), devised in 1965, was the first comprehensive drought indicator. It is considered most effective for unirrigated cropland. The PDSI combines temperature, precipitation, evaporation, transpiration, soil runoff and soil recharge data for a given region to produce a single negative number that indicates drought conditions.
This index serves as an estimate of soil moisture deficiency and roughly correlates with drought severity. The PDSI is the most commonly used index for drought monitoring and research. It has been widely used in tree-ring-based reconstructions of past droughts in North America and other regions.
In 1999, the U.S. Drought Monitor replaced the PDSI as the nation's drought indicator.
"One index can't cover the whole United States," Miskus said. "The Drought Monitor uses a lot of different tools to assess drought."
The nationwide Drought Monitor categorizes drought into five levels of severity:
- abnormally dry (category D0, corresponding to a PDSI between -1.0 and 1.9)
- moderate drought (D1, PDSI between -2.0 and -2.9)
- severe drought (D2, PDSI between -3.0 and -3.9)
- extreme drought (D3, PDSI between -4.0 and -4.9)
- exceptional drought (D4, PDSI between -5.0 and -5.9)
History of U.S. droughts
In the United States, the most devastating drought on record occurred in the 1930s during the so-called "Dust Bowl" years. According to the National Climatic Data Center, the drought affected almost the entire Plains region and covered more than 60 percent of the country at its peak in July 1934. It caused the migration of millions of people from the Plains to other parts of the country, especially the West Coast.
Researchers think a high-pressure ridge over the West Coast deflected moisture-bringing storms in 1934, causing the severe Dust Bowl droughts. This ridging pattern has been in place during some of the West's worst droughts, such as the 1976 and 2013 California droughts — two of the worst dry spells in the state's history.
Persistent high pressure in the atmosphere curbs cloud formation and leads to lower relative humidity and less precipitation. In the West, prolonged droughts occur when large-scale high-pressure patterns persist for months or more, blocking storms carrying winter rains and snow.
More recent U.S. droughts, such as those of the 1950s, 1988 and 2000, have also had serious economic and societal impacts. Between 1980 and 2014, 16 drought events cost a combined $210 billion in the United States, and thousands of people died due to the effects of drought, according to NOAA.
In June 2012, 55.8 percent of the land in the lower 48 U.S. states was in drought, the highest figure in the history of the U.S. Drought Monitor. As of July 2018, about 38 percent of the contiguous U.S. was categorized as in moderate to extreme drought, according to NOAA.
A dry future?
Drought can be devastating to an area’s economy and dangerous for human health. According to NOAA, droughts cost the United States around $9 billion a year. As the human population increases in arid regions as well as wet ones, so will the demand for water, and — with water supplies dropping at a faster rate — so will the likelihood of drought. In fact, population booms can trigger droughts almost by themselves.
Aside from the human population explosion, global warming also fuels the increased frequency and severity of droughts in many parts of the globe, now and in future. Climate change is a major factor in the western United States’ prolonged and more common droughts, according to NOAA.
According to projections by the Intergovernmental Panel on Climate Change, droughts will especially increase in subtropical areas, such as the U.S. southwest, Australia and parts of Africa and Europe, as Earth's warming causes more evaporation and shifts weather patterns, pushing the paths of storms that bring thirst-quenching rains farther north. The Union of Concerned Scientists noted that climate change can also lead to more precipitation occurring as rain instead of snow. This can lead to flooding and quick runoff instead of slow absorption that is needed in dry areas.
Additional resources
- See the National Drought Summary for the current day.
- Get more drought information at the National Weather Service's Climate Prediction Center.
- Find out whether drought is affecting your area at the U.S. Drought Portal.
- UNICEF’s list of counties currently affected by drought
- Reducing Poverty, Protecting Livelihoods and Building Assets in a Changing Climate Social Implications of Climate Change in Latin America and the Caribbean
This article was updated on Sept. 28, 2018, by Live Science Contributor Alina Bradford.
Sign up for the Live Science daily newsletter now
Get the world’s most fascinating discoveries delivered straight to your inbox.
Natalie Wolchover was a staff writer for Live Science from 2010 to 2012 and is currently a senior physics writer and editor for Quanta Magazine. She holds a bachelor's degree in physics from Tufts University and has studied physics at the University of California, Berkeley. Along with the staff of Quanta, Wolchover won the 2022 Pulitzer Prize for explanatory writing for her work on the building of the James Webb Space Telescope. Her work has also appeared in the The Best American Science and Nature Writing and The Best Writing on Mathematics, Nature, The New Yorker and Popular Science. She was the 2016 winner of the Evert Clark/Seth Payne Award, an annual prize for young science journalists, as well as the winner of the 2017 Science Communication Award for the American Institute of Physics.


