Rob Moore is a senior policy analyst for NRDC where he is part of a team devoted to protecting U.S. water resources. Moore contributed this article to Live Science's Expert Voices: Op-Ed & Insights.
The U.S. Federal Emergency Management Agency (FEMA) is tasked with helping evaluate the nation's vulnerability to flooding and storm surges, and providing maps that reflect the best scientific understanding of where flooding is most likely to occur.
FEMA maps guide people out of harm's way, helping homeowners make informed choices about where they live; aiding cities as they decide where where to build critical infrastructure, schools and hospitals; and assisting business owners as they decide where to set-up shop.
But FEMA's flood maps have never accounted for the future impacts of climate change on flood risk.
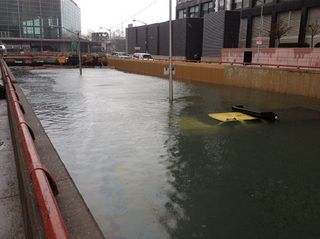
Hurricane Sandy served as a wake-up call for New York and New Jersey — and the nation — to become better prepared for flooding and the other impacts of climate change. As Sandy illustrated with fearsome efficiency, flooding is among the biggest risks the nation faces from climate change — as the climate warms, sea levels rise while extreme weather and storm surges raise the likelihood of floods.

Given that it can take two decades or longer for FEMA to update flood maps for an area, it's important that those maps start providing a more realistic look at both present and future risk.
In fact, doing so is now required by law. In 2012, Congress passed legislation that required FEMA to factor in future climate risks, as part of the Biggert-Waters Flood Insurance Reform Act.
Sign up for the Live Science daily newsletter now
Get the world’s most fascinating discoveries delivered straight to your inbox.
Given the impact of Hurricane Sandy it was hoped that new maps for New York City might be the test case for how to account for sea-level rise and climate-related impacts. But when FEMA released updated maps recently, these risks were still not accounted for.
NRDC filed formal comments on the new maps with FEMA today, raising the fact that FEMA did not factor-in future sea-level rise and other climate factors, as it is now required to do. Our analysis also shows that the past decade, or so, of sea-level rise (about 2-3 inches) was not accounted for in the maps, nor were the computer models calibrated against data from Sandy. Instead they were calibrated to earlier, less extensive floods. While the new maps are a big improvement over the previous ones, there are areas inundated by Sandy that still lie outside the newly mapped 100- or 500-year flood plains — and the impact of sea-level rise on future flood risk isn't accounted for, at all.
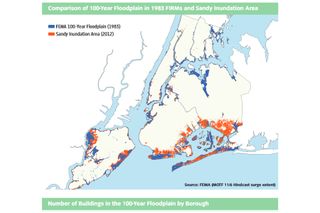
When Hurricane Sandy flooded parts of New York City many residents never expected to be underwater because flood maps did not show their neighbored as being in the danger zone. In the aftermath, it became all too clear how out of date FEMA's maps of flood zones were, having left communities in the dark about the risks they actually faced, as illustrated in the image below.

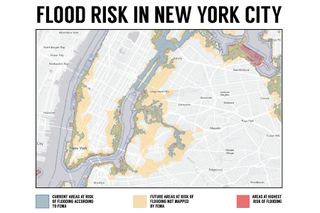
Residents of New York will likely find that FEMA's newly proposed maps are similarly obsolete in coming years. As sea levels continue to rise , the areas susceptible to flooding will also increase. The New York Department of State, using data from FEMA's new flood maps and storm-modeling data from the National Oceanic and Atmospheric Administration, assembled an interesting set of Risk Assessment Maps that show how flood risks change in response to sea level rise. Below is a comparison between those maps and FEMA's.

As you can see, the area at risk in the future is far more extensive than FEMA's new maps indicate. New Yorkers may not feel the impacts of this in the short-term, but the last maps were not updated for 30 years. If New York has to wait another 30 years, FEMA's proposed maps seriously underestimate the risk of flooding for the city.
New York is not alone. All across the country, river- and coastal-flood maps are woefully out of date. New Yorkers know firsthand the importance of making sure FEMA's updated maps reflect real flooding risks. We are counting on the agency to revisit their updated maps and give New Yorkers — and ultimately the entire nation — a real assessment of what's at stake, and how to better prepare for the future.
Moore's most recent Op-Ed was "After Sandy, Lessons from Historic 1993 Flood Resurface". The views expressed are those of the author and do not necessarily reflect the views of the publisher. This version of the article was originally published on Live Science.

