Q&A: The 'Snowman' Talks Wild Winter Weather
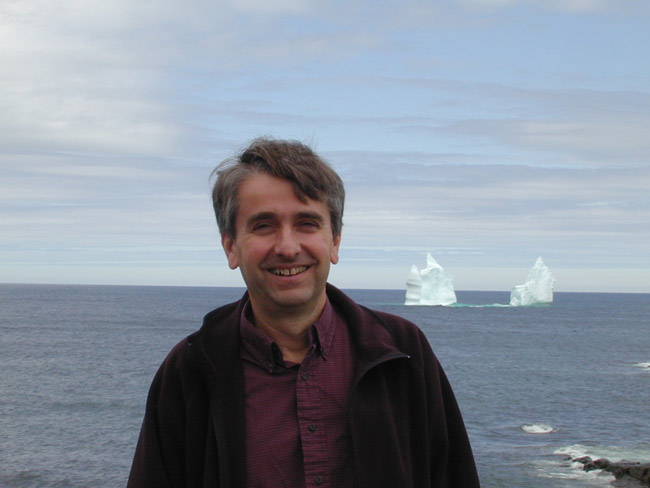
When snow hits the ground, New Jersey's state climatologist gets calls from the morning news shows about the best packing snow conditions and snowman fashion accessories. But David Robinson also runs an international snow-cover database that includes satellite data from the past five decades.
That data on snow cover comes from the National Oceanic and Atmospheric Administration (NOAA), but Robinson cleans up the data and updates a map so that people can compare present snowfall with that of past years. Such information, hosted by Rutgers University in New Jersey, ended up in the executive summary of the most recent report by the Intergovernmental Panel on Climate Change.
LiveScience caught up with Robinson while reporting from the fall meeting of the American Geophysical Union in December to talk about all things snow-related.
Q: Thanks for taking the time to talk.
A: You know, I've done the white Christmas stories before. I've actually done two interviews over my years as a snow scientist, although both may have come at me — I'm the state climatologist in New Jersey — and they may have just come from reporters on how to build a snowman.
They call, "Oh, what's the best snow, and what do you say to do this?" I've gotten such a kick out of those, "Well, New Jersey can have good snow because it's not real powdery and it's often wet enough." One time I talked to a fashion person about how to decorate the snowman after it was built, so I had to help them construct it … the point is you have to have fun with this sometimes.
Q: Right. Speaking of snow, what about all those strange snowfall events we hear about?
Sign up for the Live Science daily newsletter now
Get the world’s most fascinating discoveries delivered straight to your inbox.
A: You can find snow in some odd places at somewhat unusual times of the year, and it's a fortuitous alignment of cold and moisture. It doesn't signify the coming ice age, nor is it indicative of global warming. In the short term, while it's an extreme, and climate change is likely to lead to more extremes, you know as well as I do that one extreme doesn't cut it.
Then there's always the fact with all of these [events] that they may have happened before, and not all that far into the past. In this CNN world, things get reported quickly. That biases the reporting record [toward the present]. It snows in Miami, you're going to get tweets and blogs and everybody's going to know. So you have to filter that these days.
Q: Does that mean we shouldn't be surprised by these unusual weather patterns?
Interestingly enough, in the first half of November, the snow cover in the western half of Eurasia was well below average. I was starting to think we were headed toward satellite record period lows, and then the last two weeks of the month, just … bam! And North America was low until mid-November, and then it just exploded. If you wait around long enough … I always say the difference is that meteorologists get the instant feedback. Climatologists have to be patient. And you can't jump to conclusions on the 15th of the month and say, "Oh, we're going to have a record for the month," because as soon as you say that, it flips around.
Now somebody was telling me … Phil Jones, poor Phil Jones from East Anglia who made all the news [about Climategate ]. Phil and I were talking this morning, and he said that some spot in England had the warmest day on record in November, last month, and the coldest day on record last month.
But that's the beauty of the climate system. When it gets into a hyperactive state you go to extremes, you go from warmth to cold. As opposed to … you get these periods of zonal flow, where the cold stays where it belongs and the warmth stays where it belongs. But if you get that jet stream in what we call meridional pattern — big buckles — and you can go from one extreme [to another]. [A meridional pattern is an atmospheric system that flows along a meridian, or a large imaginary circle on Earth's surface that crosses both poles.]
Syracuse [in New York] had about 66 inches of snow this month [December] so far. The first day of December they were 63 degrees F with two inches of rain. They just had an amazing month. On TV this morning, they tried to point out that it's half their winter snow and it's not even winter yet! Well, climatologically, it's winter. Syracuse gets impacted by lake-effect snows, and lake-effect snows are most prominent when the lakes are still warm early in the season, so it's not unusual to front-end load Syracuse's snow.
Q: Have there been any changes in snowfall or snow cover over the past years?
A: I've looked at trends in extent of snow cover. Fall and winter over the 45-year satellite record don't show a trend in snow cover (that's snow on the ground, not snowfall). But the spring[s] of each decade, the 70s, 80s, 90s, the past decade, have had decreasing amounts of spring snow cover. In other words, fall snows aren't coming later from what we've seen in the record in recent decades, but snows are melting earlier starting in mid- to late winter and working their way up.
Even last winter, North America had record extensive snow cover in February. Skeptics were out there saying, "Ooh, climate change isn't so bad." I said, "Wait until spring." Spring had the least amount of snow cover on record. We went from the most amount of snow to the least amount of snow cover. For reasons yet to be fully understood … we're still working on whether the snow packs are thinner going into the spring, whether we're bringing warm air up into the snow-covered regions earlier, or whether the background is warm enough and primed, because all you need to get is to the freezing point.
That's the neat thing about snow. It's not this linear thing — it's all about the freezing point. We had an incredibly mild winter last year in the higher latitudes, but it was still plenty cold enough to have snow. It was just a little cooler in the mid-latitudes, and that was just enough to make it snow.
Q: Have you enjoyed keeping the climate records and tracking snow cover?
A: It's been wonderful. It's something I latched onto, and I've not been a day without some type of research support since I was a grad student to look at it. Right now, when you go onto our website, you can find the daily product NOAA created. But we actually took the long-term weeklies and made a daily climatology.
So now when you go onto this website, you not only see where the snow is today, but I believe we're the only place in the world where you can hit the next button and see where it's anomalously low, or how extensive or below average. Because you look at the map and think, "Oh well, that's interesting," but then you think, "Should there be snow or shouldn't there be snow?" I hardly ever look at the map, I go right to the anomaly map. I'm real pleased and proud of that one. So it's been fun. Like I said, you got to have some fun with this. It's serious stuff — this is a key climate indicator, it integrates temperature, precipitation, weather patterns and extremes — but everybody loves to talk about snow.
For the latest snow-cover charts of the Northern Hemisphere, click here.
You can follow LiveScience Senior Writer Jeremy Hsu on Twitter @ScienceHsu.

