3-D Japan Quake Animations May Help Visualize Temblors
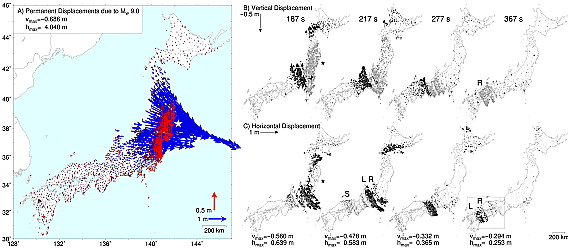
Three-dimensional animations of the devastating earthquake that rocked Japan this year are now helping visualize the effects of its motions.
These animations could help the public better understand such temblors, researchers said.
The magnitude 9.0 quake that struck off the coast of Tohoku in Japan in March ushered in what might be the world's first complex megadisaster as it unleashed a catastrophic tsunami, nuclear crisis and set off microquakes and tremors around the globe.
Scientists analyzed 3-D position data from a dense web of more than 1,200 GPS receiver stations on the ground in Japan to get a clearer picture of the shaking. [See video of the quake animation.]
"When the massive data set from Japan became available through the ARIA project of JPL-Caltech, I had to come up with a better way to look at all this information," said geophysicist Ronni Grapenthin at the University of Alaska at Fairbanks.
Slipping and sinking
The researchers have now developed animations of the quake's effects. Altogether, the vertical and horizontal motions pulled parts of the nation more than 13 feet (4 meters) to the east and sank large portions of its eastern shore more than 1.6 feet (0.5 meters) into the sea.
Sign up for the Live Science daily newsletter now
Get the world’s most fascinating discoveries delivered straight to your inbox.
"Looking at the record of all instruments simultaneously allows us to watch the evolution of this earthquake," Grapenthin told OurAmazingPlanet.
The researchers suggest their animations can help people understand the quake's effects more intuitively than standard methods, such as peaks on a seismograph or maps overlain with the locations and magnitudes of temblors.
"When you see a good portion of Japan slide into the sea, you intuitively know those arrows represent a major disaster," Grapenthin said.
The scientists added that automated methods of animating real-time data from GPS stations could be useful in properly gauging the severity of quakes. For instance, "the initial estimates of the size of the main shock [of the Tohoku earthquake] was magnitude 7.9," Grapenthin said. "Near real-time visualization of the GPS record in map view would have made clear that this is a gross underestimate, as a large portion of central Japan slid to the east."
Improving tsunami warnings
Such animations could also prove helpful in early warning systems for tsunamis and aftershocks. For instance, by seeing the estimated length of a ruptured fault, investigators can identify areas prone to large aftershocks. Also, knowing that large portions of Japan's eastern shore had sunken would have revealed that protective levees were now much lower than expected, giving rapid insight into a potential tsunami and its effects.
"Since the data is already in map view, we know exactly where these exposed regions are," Grapenthin said. "This would require an extension of the network of continuous GPS stations that transmit their data in real-time and wider availability of GPS data processing in real-time."
However, establishing such an effort in the United States wouldn't be easy.
"Funding the installation and maintenance of a dense continuous GPS network is an issue — except for regions in the Pacific Northwest and California, the U.S. comes nowhere near the GPS station density of Japan," Grapenthin cautioned. "There are places like Alaska that produced giant earthquakes with big tsunamis in the recent past and have the potential to do so again, yet the instrumentation along the Aleutian Trench is rather sparse." The Aleutian Trench is a subduction zone that runs along the southern coastline of Alaska.
Grapenthin and his colleague Jeffrey Freymueller detailed their findings online Sept. 22 in the journal Geophysical Research Letters.
This story was provided by OurAmazingPlanet, a sister site to LiveScience.

