New Maps Unlock Seafloor Secrets Off Oregon Coast

The seafloor off the Oregon coast now holds a little less mystery, thanks to a team of geologists, oceanographers and commercial fishermen. They’ve mapped the region's near-shore ocean floor in rich detail, revealing seafloor features that could affect tsunami formation, house fisheries and marine preserves and help engineers harvest energy from ocean waves.
"We're pulling up the window shade on the near-shore environment — not only for the science, but also for the practical side," said Chris Goldfinger, a geologist at Oregon State University who led the work.
One of those practical sides is a better understanding of how tsunamis form and travel in this area, so that scientists and officials can alert coastal communities in their paths.
Tsunami threat
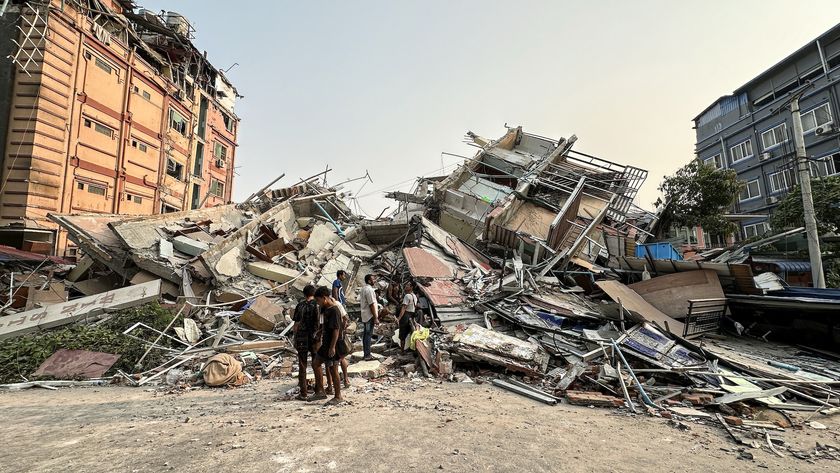
Living along the Cascadia subduction zone — where the Juan de Fuca tectonic plate is slowly sliding under the North American plate — Oregonians have plenty of reasons to be wary of tsunamis, which are triggered by major earthquakes such as the magnitude-9 one that hit the region in 1700. The tsunami triggered by that quake reached Japan and caused significant destruction.
The shape and structure of the ocean floor can affect how tsunamis affect coastal lands.
"The same way a lens focuses the sunlight, a headland can focus waves and a bay can diffuse them," Goldfinger explained. "The bathymetry itself shapes the wave and impacts how it travels toward the shore."
Sign up for the Live Science daily newsletter now
Get the world’s most fascinating discoveries delivered straight to your inbox.
What lies beneath
Until now, ocean-goers relied on nautical charts for clues about this swath of ocean floor, Goldfinger said. Those charts can provide some information about depths and distances, but not much more. The new maps reveal detailed seafloor secrets, such as the types of sands lining the bottom, the locations of rocky outcrops and the nooks and crannies of the seafloor's hidden topography.
The maps will help ecologists identify areas with rocky bottoms, which are usually the best places for marine reserves because they house the most biodiversity. Engineers will be better able to choose wave energy sites, since that equipment is better suited to areas with deep sand. The maps will also help fishermen locate reefs, rock piles and sandy-bottomed areas more easily, Goldfinger said.
The group constructed the maps using both fieldwork and digital cartography. In addition to an Oregon State University research vessel, the researchers also hired commercial fishermen and their boats to collect seafloor data.
The team now has 500-square-nautical-miles' worth of data to sift through, and they're just as likely to find questions as they are answers.
"One of the most interesting things is we really have no idea what's driving some of the topography we're seeing," Goldfinger said. "Sometimes it's obviously shaped by faults or river channels, but sometimes it's hard to even describe what we're seeing since we don't know what it is."
You can see the maps and data here: http://activetectonics.coas.oregonstate.edu/state_waters.htm.
This story was provided by OurAmazingPlanet, a sister site to LiveScience.
