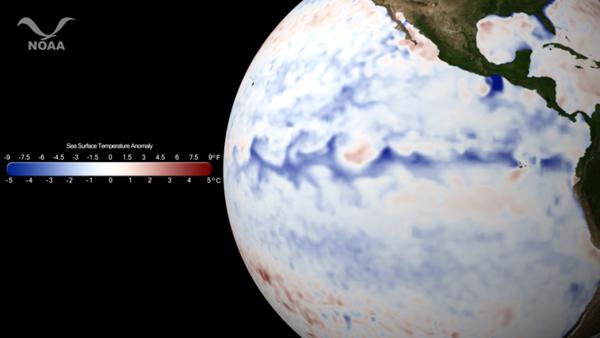
Satellite Image Shows La Nina is Back


A sea surface anomaly, or departure from the average temperature, is calculated by subtracting the temperatures from a time period of interest from the 30-year average (1981-2010) for the same time period. The resulting data shows areas that are hotter or colder than normal.
Sea surface temperature anomaly data allow scientists to quickly identify features of interest, especially for El Niño/La Niña, coastal upwelling, and hurricane intensification.
The strengthening La Niña in the Pacific Ocean brings with it a host of possible trends as outlined by the NOAA Climate Prediction Center's Seasonal Outlook released October 20, 2011. These trends include lower than normal precipitation for the southwest and southern Great Plains and Mississippi Valley.
Below normal temperatures are favored for southern sections of the Florida peninsula, northern Great Plains and northern Rockies. Trends favor modest warmer than normal conditions for much of the east.
This imagery uses the Optimum Interpolation SST (commonly called OI SST) anomaly dataset generated by NOAA's National Climatic Data Center. OI SST uses infrared and microwave data from polar-orbiting satellites (NOAA AVHRR; NASA AMSR-E, a previous contributor operating onboard the AQUA satellite, ceased operation October 4, 2011) and oceanic buoys to calculate one of the most accurate analyses of sea surface temperature.
- ((CONLINK|30859| Southern Drought to Continue This Winter (Thank La NiÃ
Get the world’s most fascinating discoveries delivered straight to your inbox.


