Atmospheric Pressure: Definition & Facts

Books on meteorology often describe Earth's atmosphere as a huge ocean of air in which we all live. Diagrams depict our home planet as being surrounded by a great sea of atmosphere, a few hundred miles high, divided into several different layers. And yet, that part of our atmosphere that sustains all life that we know of is, in reality, exceedingly thin and extends upward only to about 18,000 feet — just over 3 miles. And the part of our atmosphere that can actually be measured with some degree of accuracy goes up to about 25 miles (40 kilometers). Beyond that, to give a precise answer as to where the atmosphere ultimately ends is well nigh impossible; somewhere between 200 and 300 miles comes an indeterminate region where the air gradually thins and ultimately merges into the vacuum of space.
So the layer of air that surrounds our atmosphere is not so huge after all. As the late Eric Sloane, a popular authority on weather so eloquently put it: “Earth does not hang in a sea of air — it hangs in a sea of space and it has an extremely thin coating of gas on its surface.”
And that gas is our atmosphere.
Air has weight
If a person were to climb a tall mountain, like Mauna Kea on the Big Island of Hawaii, where the summit reaches to 13,796 feet (4,206 meters), contracting altitude sickness (hypoxia) is a high probability. Before ascending to the summit, visitors must stop at the Information Center, located at an altitude of 9,200 feet (2,804 m) where they are told to acclimatize to the altitude before proceeding further up the mountain. “Well, of course,” you might say, “After all, the amount of available oxygen at such a high altitude is considerably less as compared to what is present at sea level.”
But in making such a statement, you would be wrong!
In fact, 21 percent of Earth's atmosphere consists of life-giving oxygen (78 percent is composed of nitrogen and the remaining 1 percent a number of other gases). And the proportion of that 21 percent is virtually the same at sea level as well as at high-mountain altitudes.
The big difference is not the amount of oxygen present, but rather density and pressure.
That oft-used analogy of comparing air with water (“an ocean of air”) is a good one, for we are all literally swimming through air. Now picture this: A tall plastic bucket is filled to the brim with water. Now, take an ice pick and poke a hole near the top of the bucket. The water will slowly dribble out. Now take the pick and punch another hole down near the bottom of the bucket. What happens? Down there the water will rapidly squirt out in a sharp stream. The reason is the difference in pressure. The pressure that is exerted by the weight of the water down near the bottom of the bucket is greater than up near the top, so the water is “squeezed out” of the hole at the bottom.
Similarly, the pressure of all the air above our heads is the force that pushes air into our lungs and squeezes oxygen out of it and into our bloodstream. As soon as that pressure diminishes (such as when we ascend a high mountain) less air is pushed into the lungs, hence less oxygen reaches our bloodstream and hypoxiation results; again, not due to a lessening of the amount of available oxygen, but to the lessening of atmospheric pressure.
Highs and lows
So how does atmospheric pressure relate to daily weather patterns? No doubt you’ve seen weather forecasts presented on television; the on-camera weathercaster making reference to high pressure and low pressure systems. What is that all about?
Basically, in a nutshell, every day the heat of the sun varies all over the Earth. Because of unequal solar heating, temperatures vary over the entire globe; the air at the equator is much warmer than at the poles. So the warm, light air rises and spreads toward the poles and the colder, heavier air sinks toward the equator.
But we live on a planet that rotates, so this simple wind pattern is distorted to such a degree that the air is twisted to the right of its direction of motion in the Northern Hemisphere and to the left in the Southern Hemisphere. Today we know this effect as the Coriolis Force and as a direct consequence, great wind spirals are produced which we know as high and low pressure systems.
In the Northern Hemisphere, the air in low pressure areas spirals counterclockwise and inward — hurricanes, for instance, are Coriolis mechanisms, circulating air counterclockwise. In contrast, high pressure systems the air spirals clockwise and outward from the center. In the Southern Hemisphere the direction of the spiraling of the air is reversed.
So why do we generally associate high pressure with fair weather and low pressure with unsettled weather?
High pressure systems are “domes of density” that press down, while low pressure systems are akin to “atmospheric valleys” where the density of the air is less. Since cool air has less of a capacity to hold water vapor as opposed to warm air, clouds and precipitation are caused by cooling the air.
So by increasing the air pressure, the temperature rises; underneath those high pressure domes, the air tends to sink (called “subsidence”) into the lower levels of the atmosphere where temperatures are warmer and can hold more water vapor. Any droplets that might lead to the formation of clouds would tend to evaporate. The end result tends to be a clearer and drier environment.
Conversely, if we decrease the air pressure, the air tends to rise into the higher levels of atmosphere where temperatures are colder. As the capacity to hold water vapor diminishes, the vapor rapidly condenses and clouds (which are composed of countless billions of tiny water droplets or, at very high altitudes, ice crystals) will develop and ultimately precipitation will fall. Of course, we could not forecast zones of high and low pressure without employing some sort of device to measure atmospheric pressure.
Enter the barometer
Atmospheric pressure is the force per unit area exerted by the weight of the atmosphere. To measure that weight, meteorologists use a barometer. It was Evangelista Torricelli, an Italian physicist and mathematician who proved in 1643 that he could weigh the atmosphere against a column of mercury. He actually measured pressure converting it directly to weight. The instrument Torricelli designed was the very first barometer. The open end of a glass tube is placed in an open dish of mercury. Atmospheric pressure forces the mercury to rise up the tube. At sea level, the column of mercury will rise (on average) to a height of 29.92 inches or 760 millimeters.
Why not use water instead of mercury? The reason is that at sea level, the water column would be about 34 feet high! Mercury on the other hand, is 14 times denser than water and is the heaviest substance available that remains a liquid at ordinary temperatures. That permits the instrument to be of a more manageable size.
How NOT to use a barometer
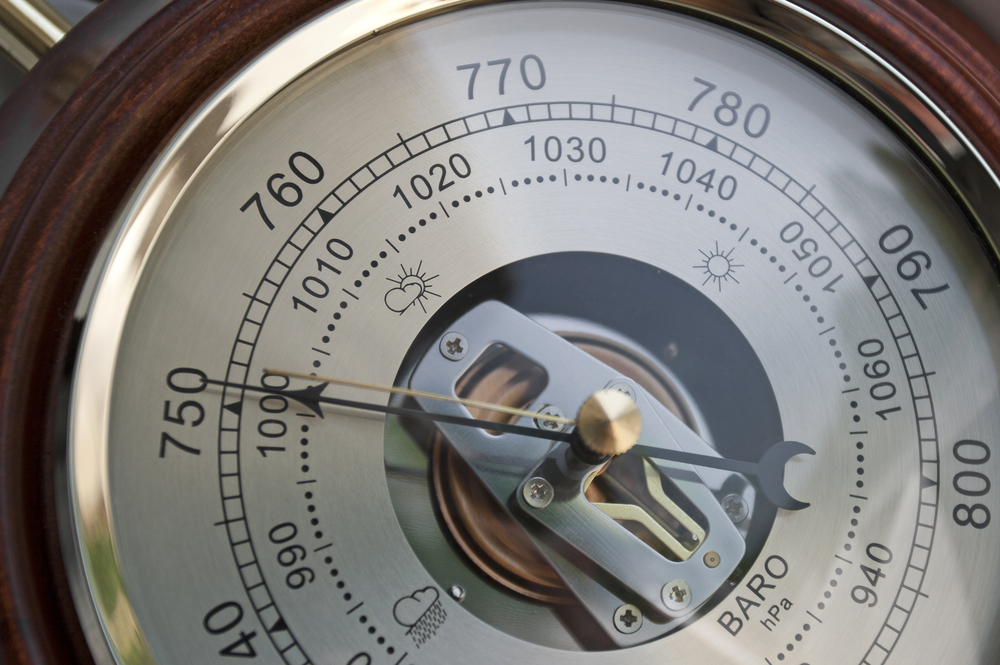
Right now you might have a barometer hanging on the wall of your home or office, but in all likelihood it’s not a tube of mercury but rather a dial with an arrow that points to the current barometric pressure reading. Such an instrument is called an aneroid barometer, which consists of a partially evacuated metal cell that expands and contracts with changing pressure and is attached to a coupling mechanism that drives an indicator (the arrow) along a scale graduated in pressure units, either in inches or millibars.
Usually on the indicator dial you will also see words such as “Sunny,” “Dry,” “Unsettled,” and “Stormy.” Supposedly, when the arrow points toward these words it is supposed to be an indication of the expected weather ahead. “Sunny,” for instance, can usually be found in the range of high barometric pressure — 30.2 or 30.3 inches. “Stormy,” on the other hand would be found in the range of low barometric pressure — 29.2 or lower, perhaps even on occasion below 29 inches.
This would all seem logical, except it is all rather simplistic. There can be times, for example, when the arrow will be pointing to “Sunny,” and the sky instead is completely overcast. And on other occasions, the arrow will be suggesting “Stormy,” and yet what you might see is sunshine mixed with blue sky and fast-moving, puffy clouds.
How to properly use a barometer
That’s why along with the black indicator arrow, you should also pay attention to another arrow (usually gold) that can be manually adjusted to any part of the dial. When you check your barometer, first tap the front of the barometer lightly to remove any internal friction and then align the gold arrow with the black one. Then check back some hours later to see how the black arrow has changed relative to the gold one. Is the pressure rising or falling? If it’s falling, is it doing so rapidly (perhaps dropping several tenths of an inch)? If so, a storm could be approaching. If a storm has just passed by and the skies have cleared, the barometer might still be indicating “Stormy” weather, but if you had set the gold arrow some hours ago, you almost certainly would see that the pressure is now rapidly rising, suggesting that — in spite of the indication of storminess — that fair weather is on the way.
And your forecast can be improved still further by combining your record of changing barometric pressure with the changing direction of the winds. As we have already learned, air circulates in a clockwise fashion around high pressure systems and counterclockwise around low pressure systems. So if you see a trend toward rising pressure and a northwesterly wind, you might expect generally fair weather to move in, as opposed to a falling barometer and an east or northeast wind which could eventually lead to clouds and precipitation.
Sign up for the Live Science daily newsletter now
Get the world’s most fascinating discoveries delivered straight to your inbox.


