How Low Will Summer Sea Ice Go? Ponds May Hold Key
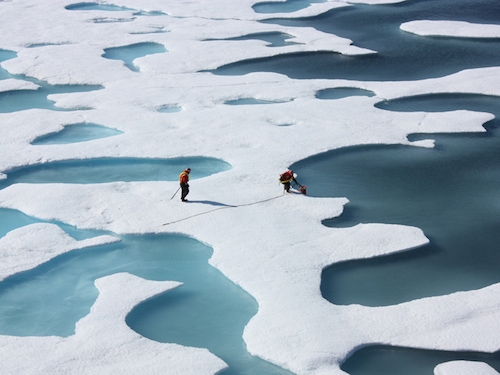
The spring Arctic sea ice melt is well underway, the ice contracting to cover a progressively smaller area until it eventually reaches its annual minimum extent at the end of the summer.
Though the melt has so far progressed in fits and starts, the ice has consistently covered a below-average area since reaching its annual maximum in March, according to the latest update from the National Snow and Ice Data Center. But what this low early spring extent means for the annual September minimum is unclear, as models have proven to be poor at predicting the minimum extent when it is unusually high or low.
A new study has suggested, though, that projections might improve if the models took into account how much of the sea ice surface was covered in melt ponds, or the pools of water that collect on top of the ice as it melts. These pools reinforce the melt cycle because their blue depths absorb the sun’s rays, causing warming and further melt, while the bright white ice reflects the light.
The annual summer minimum is closely watched, in part, because although it is a normal part of the annual sea ice cycle, it has stood as a particularly stark marker of the steady decline in Arctic sea ice fueled by global warming. The changing ice patterns in the Arctic can influence circulation patterns in the ocean and the atmosphere, with effects potentially extending far outside of the polar realm.
Spring extent
The sea ice of the Arctic hit its maximum extent for the year on March 21, peaking at 5.7 million square miles, some 282,000 square miles below the 1981-to-2010 average, after a late-season surge in ice formation. That area was the fifth lowest maximum in the satellite record, which goes back to 1978, an example of the trend in declining ice extents that comes with Arctic warming.
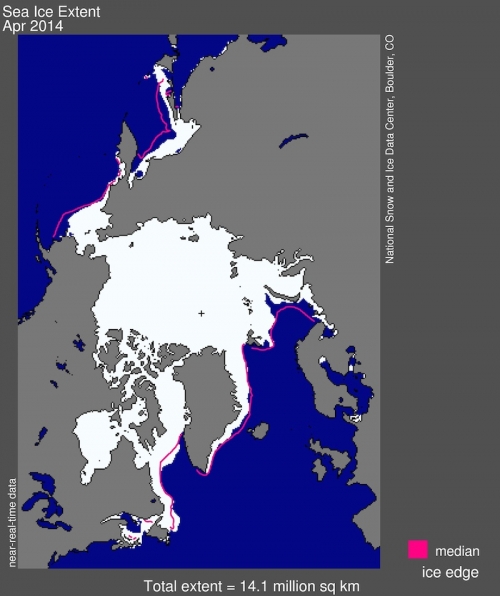
The late surge in ice growth was followed by a rapid retreat in early April, before the rate of melt slowed later in the month. The average rate of decline in April was 11,700 square miles per day -- roughly the combined size of Rhode Island and Massachusetts -- slower than the average rate of 14,800 square miles per day during the 1981-to-2010 time period.
Sign up for the Live Science daily newsletter now
Get the world’s most fascinating discoveries delivered straight to your inbox.
The average extent of the ice in April was 5.46 million square miles, 236,000 square miles below the average, but nearly 300,000 square miles above the record low for the month, set in 2007, according to the latest NSIDC data. The April 2014 extent was still small enough to also rank as the fifth lowest on record.
But the condition of the ice now doesn’t seem to have a clear connection to its state at the end of the summer, at least not one that scientists have been able to suss out. Various models have been used to try to project the summer minimum, with fairly good results when that minimum fits within the long-term trend of decline. But when the minimum falls outside of those bounds, the models don’t see it coming, a study detailed in the journal Geophysical Research Letters earlier this year found.
Neither the extent nor the thickness of the sea ice at the end of the winter seems to correlate well with summer extent, according to the study. Co-author Julienne Stroeve, of the NSIDC, told Climate Central in April that this result shows how important the Arctic’s summer weather is in determining just how low the ice will go.
Melt pond projections
The new study, published online April 20 in the journal Nature Climate Change, may have found a way to improve the seasonal sea ice projections, though, by including those pools of meltwater.
Researchers used the aptly named CICE (“see-ice”) model to simulate the evolution of melt ponds (because good observations of the ponds are hard to come by) and looked at a statistical comparison between the melt pond area in May (when the ponds first form) and the summer ice extent. What they got was a “surprisingly strong correlation,” study author David Shröder, of the University of Reading in England, told Climate Central. It was actually stronger than the correlation between the thickness of the spring ice (as thinner ice would be more susceptible to melt) and the summer minimum.
The strong correlation makes sense given the clear underlying feedback of meltwater absorbing solar radiation (increasing the albedo of the ice, in scientific parlance) and causing more melt, Shröder said. (The amount of melt pond coverage is also an indicator of the state of the ice in spring, as those ponds can cover more ground on relatively flat first-year ice, which is thinner because it has just formed, than on craggy older ice, which is typically thicker.)
“So certainly having an earlier melt onset and earlier melt pond formation helps to enhance the ice-albedo feedback that leads to more ice melted in the summer,” Stroeve wrote in an email. Though the summer weather is still a key factor in the eventual minimum extent.
Shröder’s team predicted that September 2013 would have an average ice extent of 5.55 million square kilometers, which ended up being closer to the observed extent of 5.35 million square kilometers than any of the 23 other competing predictions made by climate scientists (or, presumably, the informal pools some run to see who can pick the minimum extent).
Shröder said that his team will be making a prediction again for this year’s summer ice extent at the beginning of June based on the melt pond formation in May.
But to see what this summer brings for ice melt and the minimum extent (and who wins those pools), scientists, like everyone else, will just have to wait and see.
You May Also Like Melt of Key Antarctic Glaciers ‘Unstoppable,’ Studies Find Watch the Earth Live From Space, Music Not Included Can We Talk About the New NCA Website? John Allen: Scientist with an Eye on the Storm
Original article on Climate Central. Follow the author on Twitter @AndreaTWeather or @ClimateCentral. We're also on Facebook & other social networks.

Andrea Thompson is an associate editor at Scientific American, where she covers sustainability, energy and the environment. Prior to that, she was a senior writer covering climate science at Climate Central and a reporter and editor at Live Science, where she primarily covered Earth science and the environment. She holds a graduate degree in science health and environmental reporting from New York University, as well as a bachelor of science and and masters of science in atmospheric chemistry from the Georgia Institute of Technology.

