How Ebola Spread: Map Could Aid Outbreak Responses

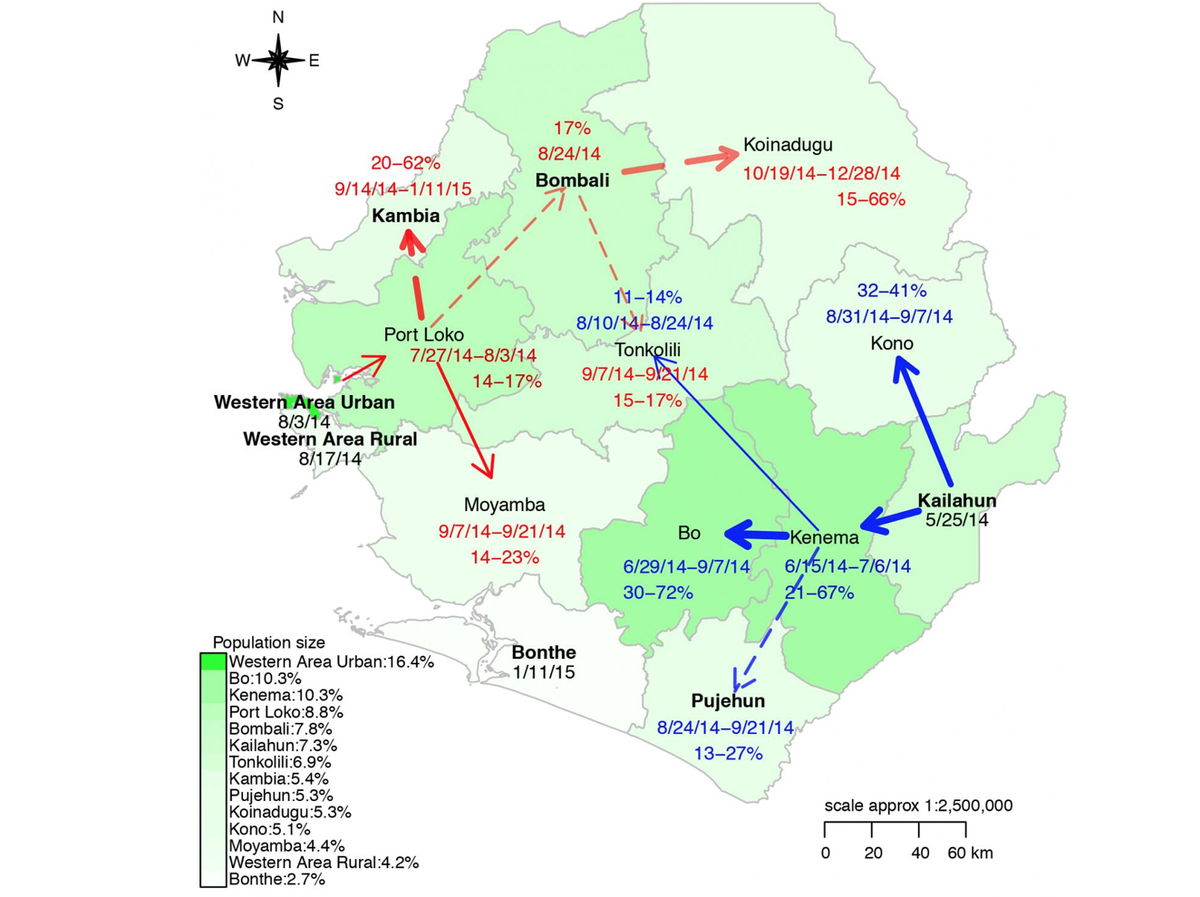
A new map reveals the path that the Ebola virus took during the outbreak in Sierra Leone, giving a detailed picture of how and where the disease spread, a new study said.
The researchers made the map using a new statistical model, and they say it could be used in the future to improve the way help is delivered to outbreak regions.
"For a future outbreak, this is something that can be readily applied to help identify the regions that need intervention most critically," said study author Jeffrey Shaman, an associate professor of environmental health sciences at Columbia University's Mailman School of Public Health. The model could help authorities figure out where to best deploy people to respond to the outbreak, he said.
To chart the course of the Ebola outbreak in Sierra Leone, the researchers looked at data from the Sierra Leone Ministry of Health and Sanitation.
The outbreak began in the district of Kailahun, which borders the countries of Guinea and Liberia, in late May 2014. By mid-June, Ebola had spread west to the nearby city of Kenema, the results showed. By early July, an epidemic of the disease was firmly established in that city, and it was continuing to spread west, south and north from there. [Where Did Ebola Come From?]
Also in early July, a separate, second cluster of Ebola cases emerged in Sierra Leone's capital city of Freetown. From there, the virus spread east to the city of Port Loko by late July, and then quickly spread east and south from there.
More than 14,000 people in Sierra Leone contracted Ebola during the outbreak, and nearly 4,000 people died from the disease, according to the Centers for Disease Control and Prevention.
Sign up for the Live Science daily newsletter now
Get the world’s most fascinating discoveries delivered straight to your inbox.
The two cities, Kenema and Port Loko, were critical junction points in the outbreak because of their many connections with other districts in Sierra Leone, the researchers concluded. This result suggests that there were windows of opportunity to control the spread of the disease within Sierra Leone, the study said.
The first window of time was the period before the epidemic reached Kenema, which lasted about one month, according to the researchers' estimates. The second window was shorter, but there was period of time before Ebola reached Port Loko when interventions could have stemmed the outbreak there, the researchers said.
The statistical method the researchers used in the study involved three main types of information, all of which were available during the recent outbreak: the home district of each Ebola patient, the population of that district and the geographic distance between districts, the researchers said.
The traditional method of tracking disease, called contact tracing, involves interviewing patients and other people who come into contact with health workers. The new method does not eliminate the need for contact tracing, but supplements it, Shaman said.
"But when you have an outbreak, there is a lot of chaos. There are a lot of difficulties that people encounter, and there is not nearly as much information as any of us would like," Shaman told Live Science.
The new model allows researchers to fill in those information gaps, he said.
"It allows us to understand what is going on and make very educated estimations as to how the disease has [progressed] and is progressing and will progress, and to help identify those critical points for intervention," he said.
The new findings were published today (Nov. 10) in the Journal of the Royal Society Interface.
Follow Agata Blaszczak-Boxe on Twitter. Follow Live Science @livescience, Facebook & Google+. Originally published on Live Science.


