Tiny slices
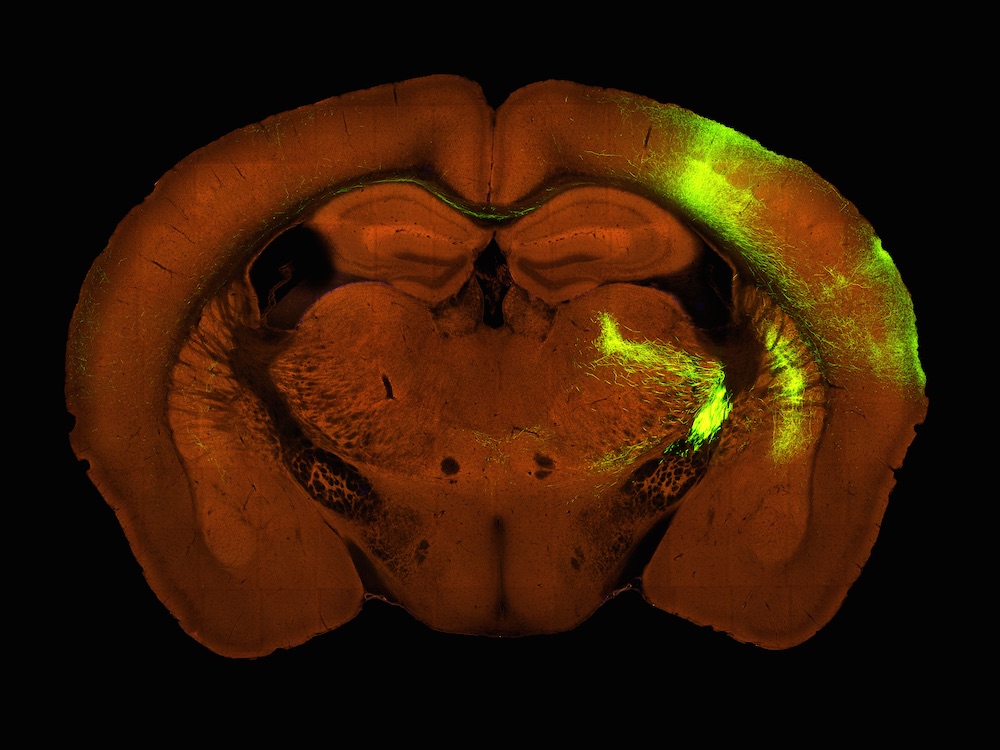
Researchers recently created a type of Google Maps for the mouse brain. The project, called the Allen Mouse Common Coordinate Framework, began with 234,500 individual sections from 1,675 whole mouse brains. These were collected as part of the Allen Mouse Brain Connectivity Atlas.
An average brain
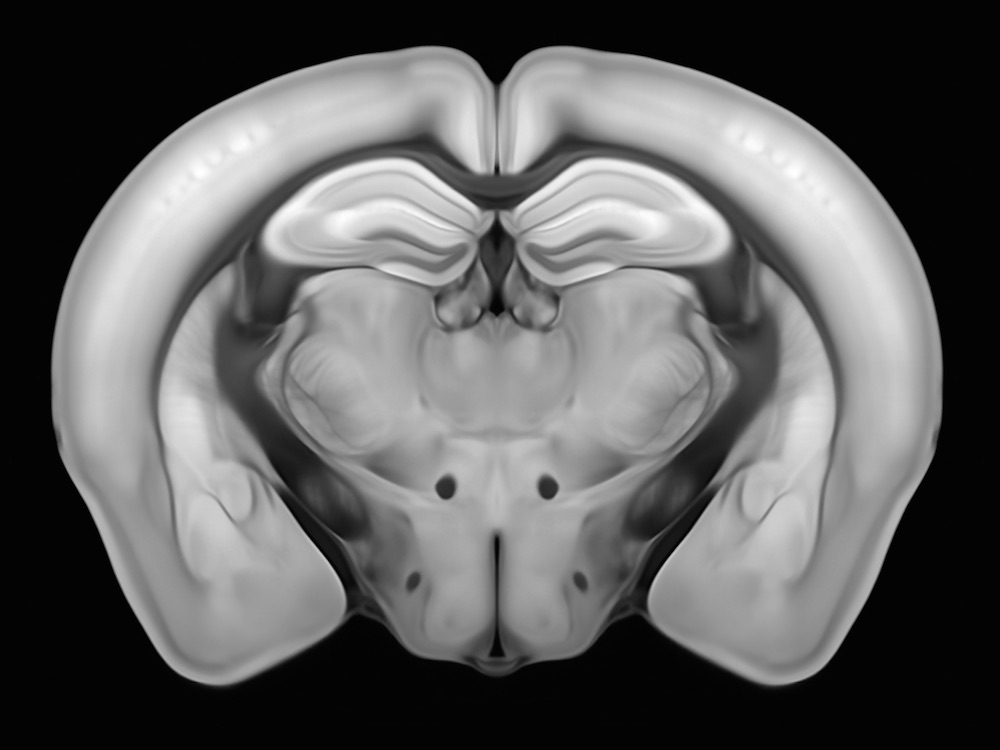
A computer program then averaged all 1,675 specimens into a single 3D image, which then became the archetypal average mouse brain for the project.
Not your average mouse
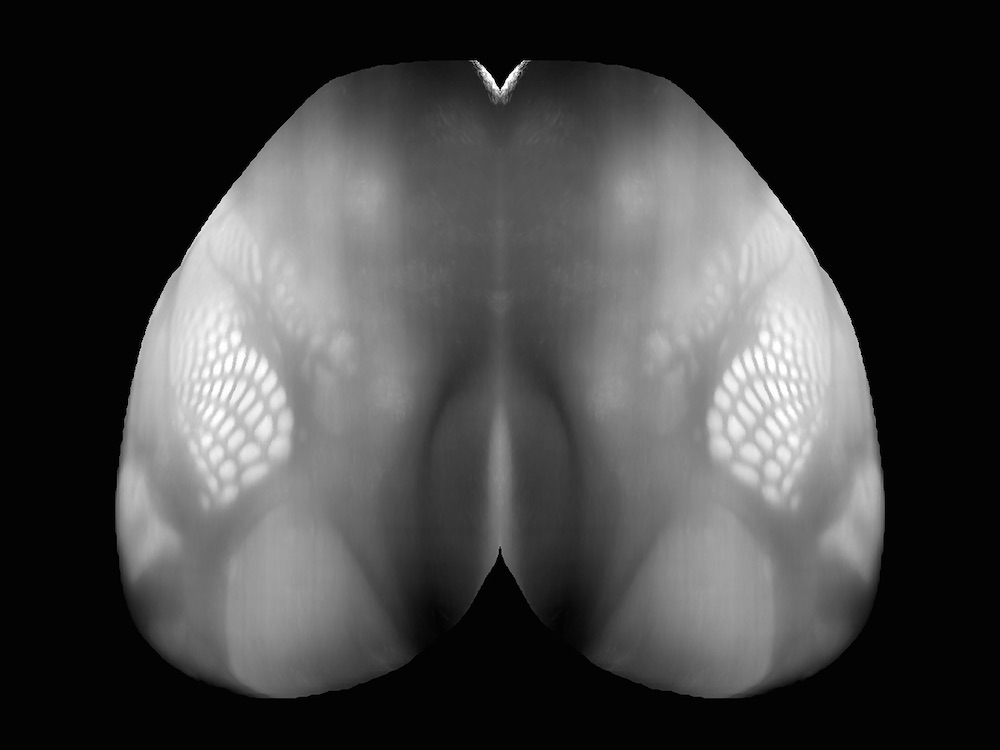
Here, one view of this average mouse brain. After the brain was averaged, other sophisticated algorithms were used to clean up noise in messy images and improve the spatial resolution.
Glowing brain cells
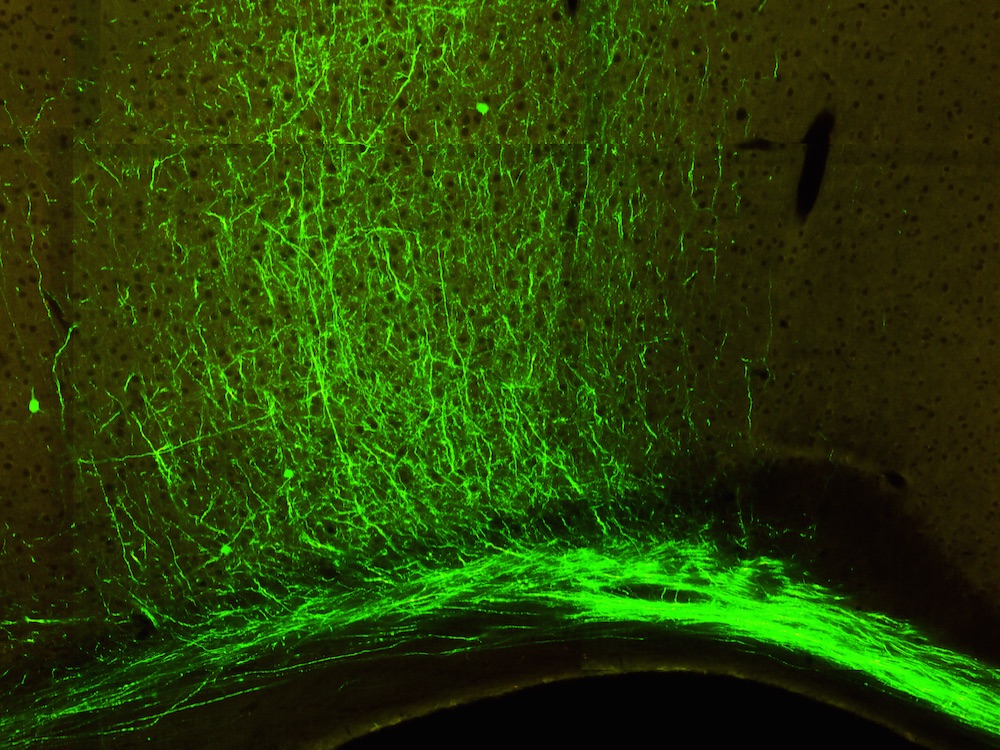
Next, anatomists painstakingly tracked fluorescently labeled neurons to identify boundaries between brain regions.
An average brain
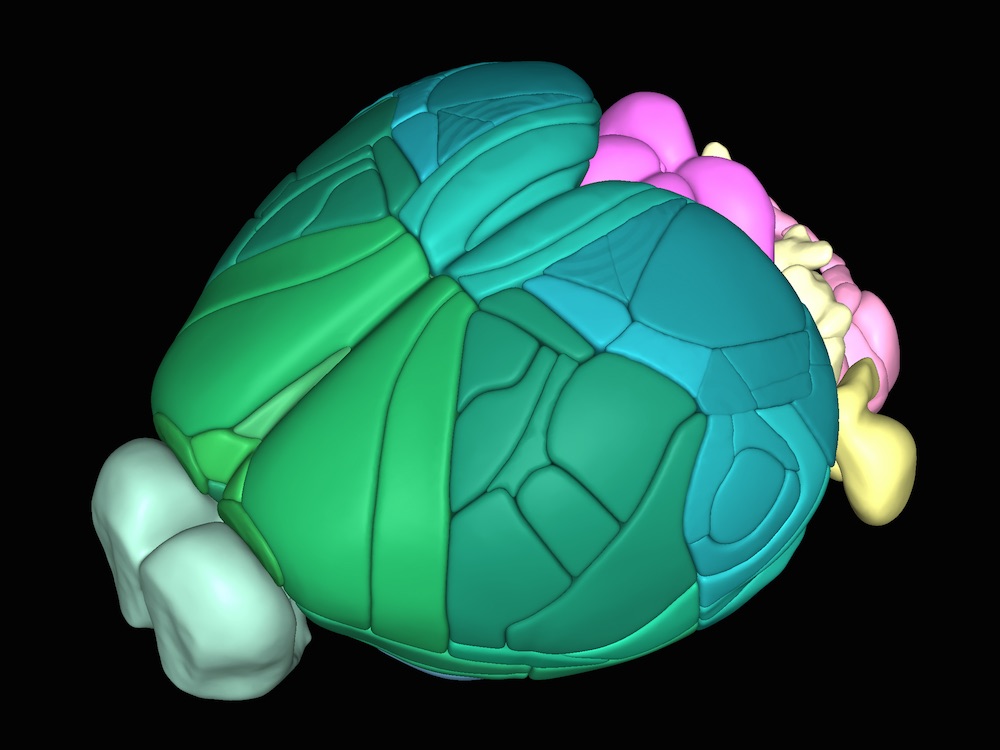
The team then created an antomical model that revealed the boundary regions in the mouse brain, shown here in different colors.
Detailed brain regions
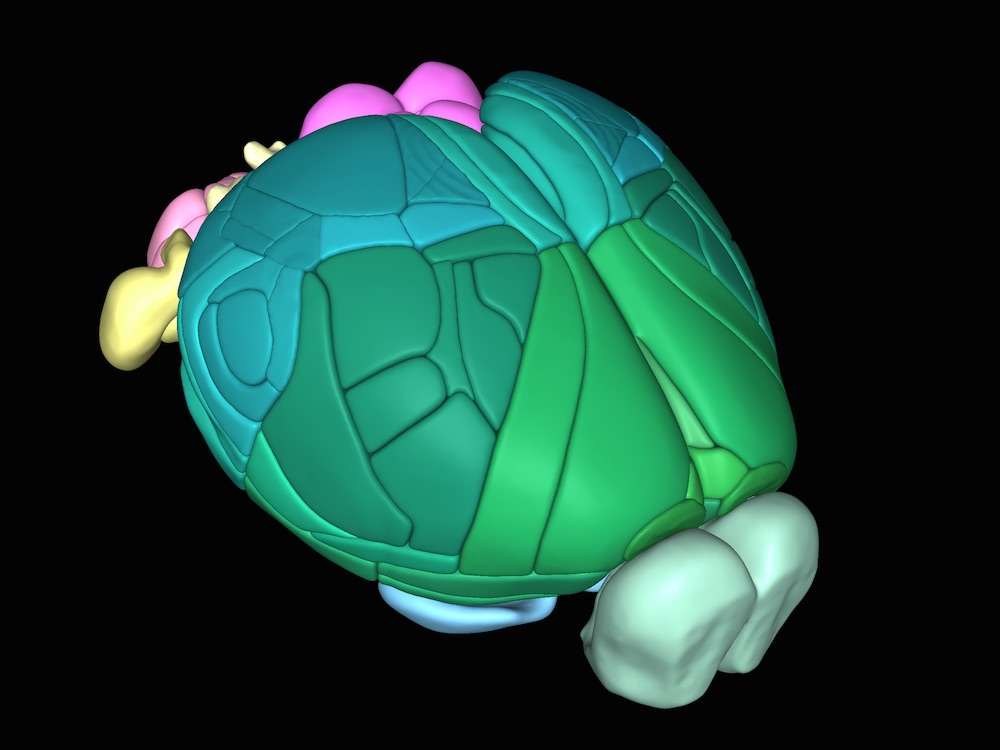
Another view of the boundaries between brain regions in a mouse, as defined by data from the Allen Brain Atlas Mouse Connectivity project.
Anatomical structure
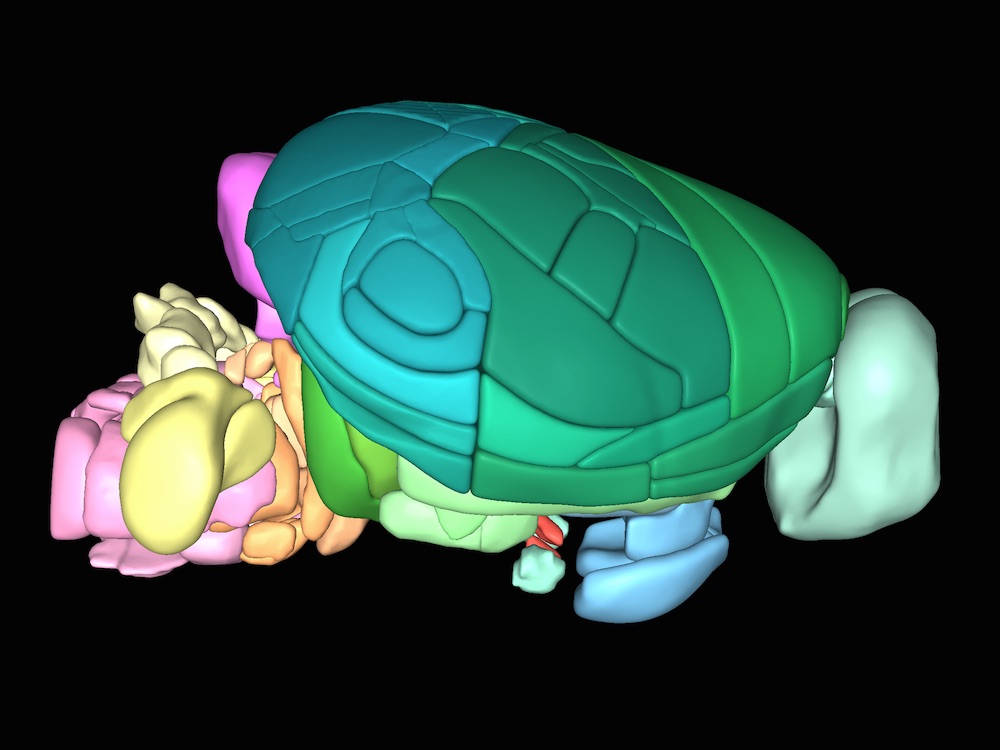
Here, more views of these individual brain regions.
Sign up for the Live Science daily newsletter now
Get the world’s most fascinating discoveries delivered straight to your inbox.
Top view of the mouse brain
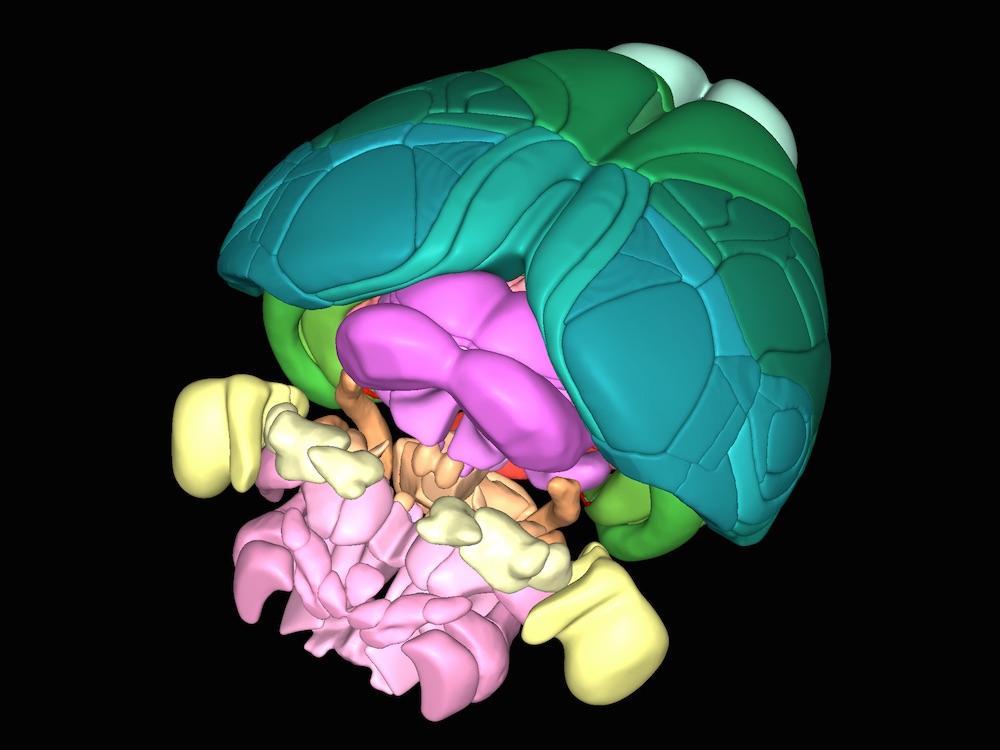
Though the project is focused on mapping connections in a mouse brain in 3D, the ultimate goal is to do the same for the human brain. here, the same boundaries in the mouse brain shown in a different view.
Capturing connections
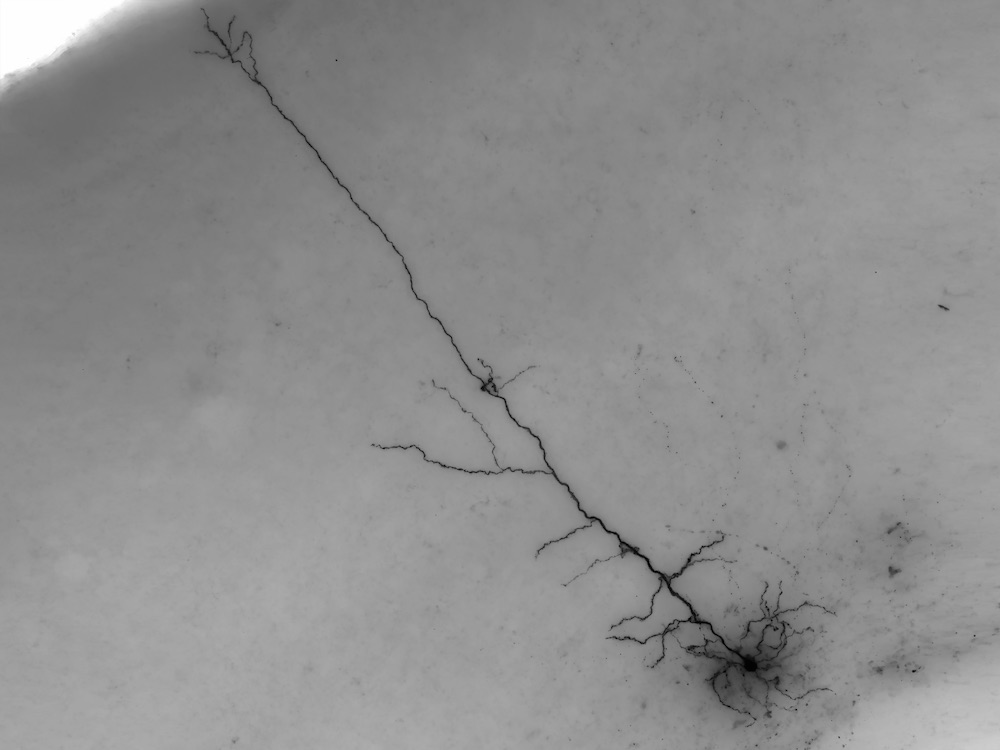
As part of the Allen Institute’s ongoing Cell Types Database project, scientists take high-resolution pictures of individual neurons
Digitally encoded neurons
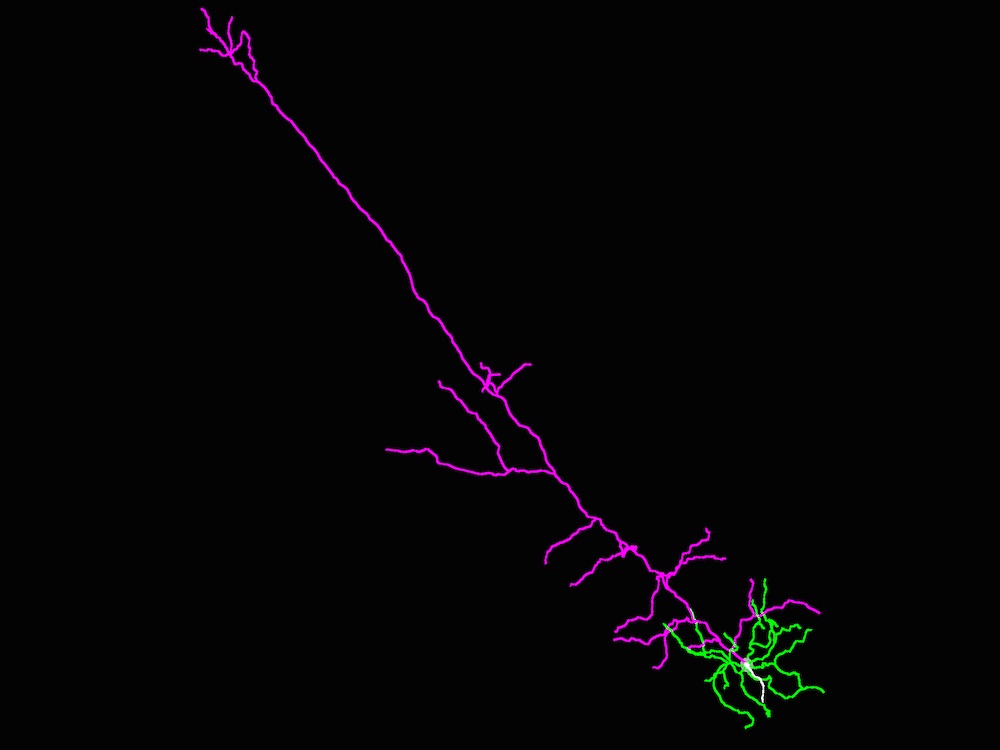
From high resolution images of individual neurons, the researchers created digital reconstructions of those cells The green portion shows the dendrite, while the pink shows the apical dendrite. The gray shows the axon.
A view of the brain
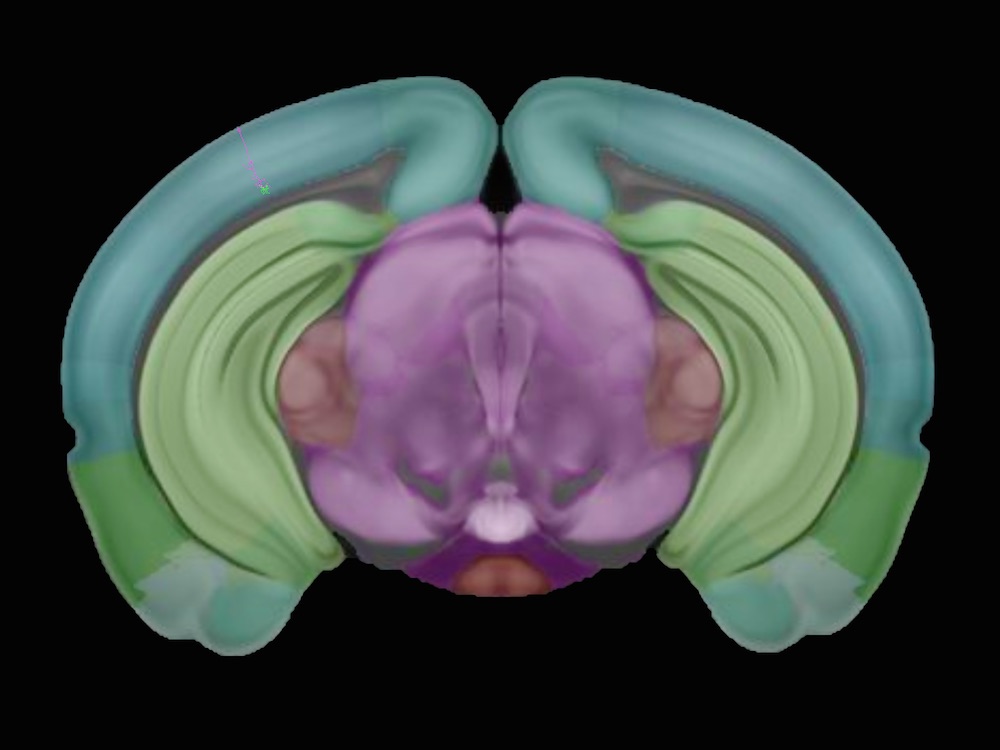
Here, another view of the Allen Common Connectivity Framework, which acts as a Google Maps or GPS for the brain

Tia is the managing editor and was previously a senior writer for Live Science. Her work has appeared in Scientific American, Wired.com and other outlets. She holds a master's degree in bioengineering from the University of Washington, a graduate certificate in science writing from UC Santa Cruz and a bachelor's degree in mechanical engineering from the University of Texas at Austin. Tia was part of a team at the Milwaukee Journal Sentinel that published the Empty Cradles series on preterm births, which won multiple awards, including the 2012 Casey Medal for Meritorious Journalism.
