NASA Images Show Gradual Separation of Massive New Antarctic Iceberg
Multiple NASA satellites have captured images of the dramatic and long-awaited birth of one of the largest icebergs ever recorded, which broke off an Antarctic ice shelf this week.
The enormous iceberg contains more than 1.1 trillion tons (1 trillion metric tons) of water and is about the size of Delaware. Its separation from Antarctica's Larsen C ice shelf occurred sometime between July 10 and today (July 12), and was first reported by scientists with the U.K.-based Project Midas, an Antarctic research group. The calving was confirmed by satellite images from the European Space Agency's Copernicus Sentinel-1 mission. [How Satellites Watched the New Iceberg's Birth Over Time]
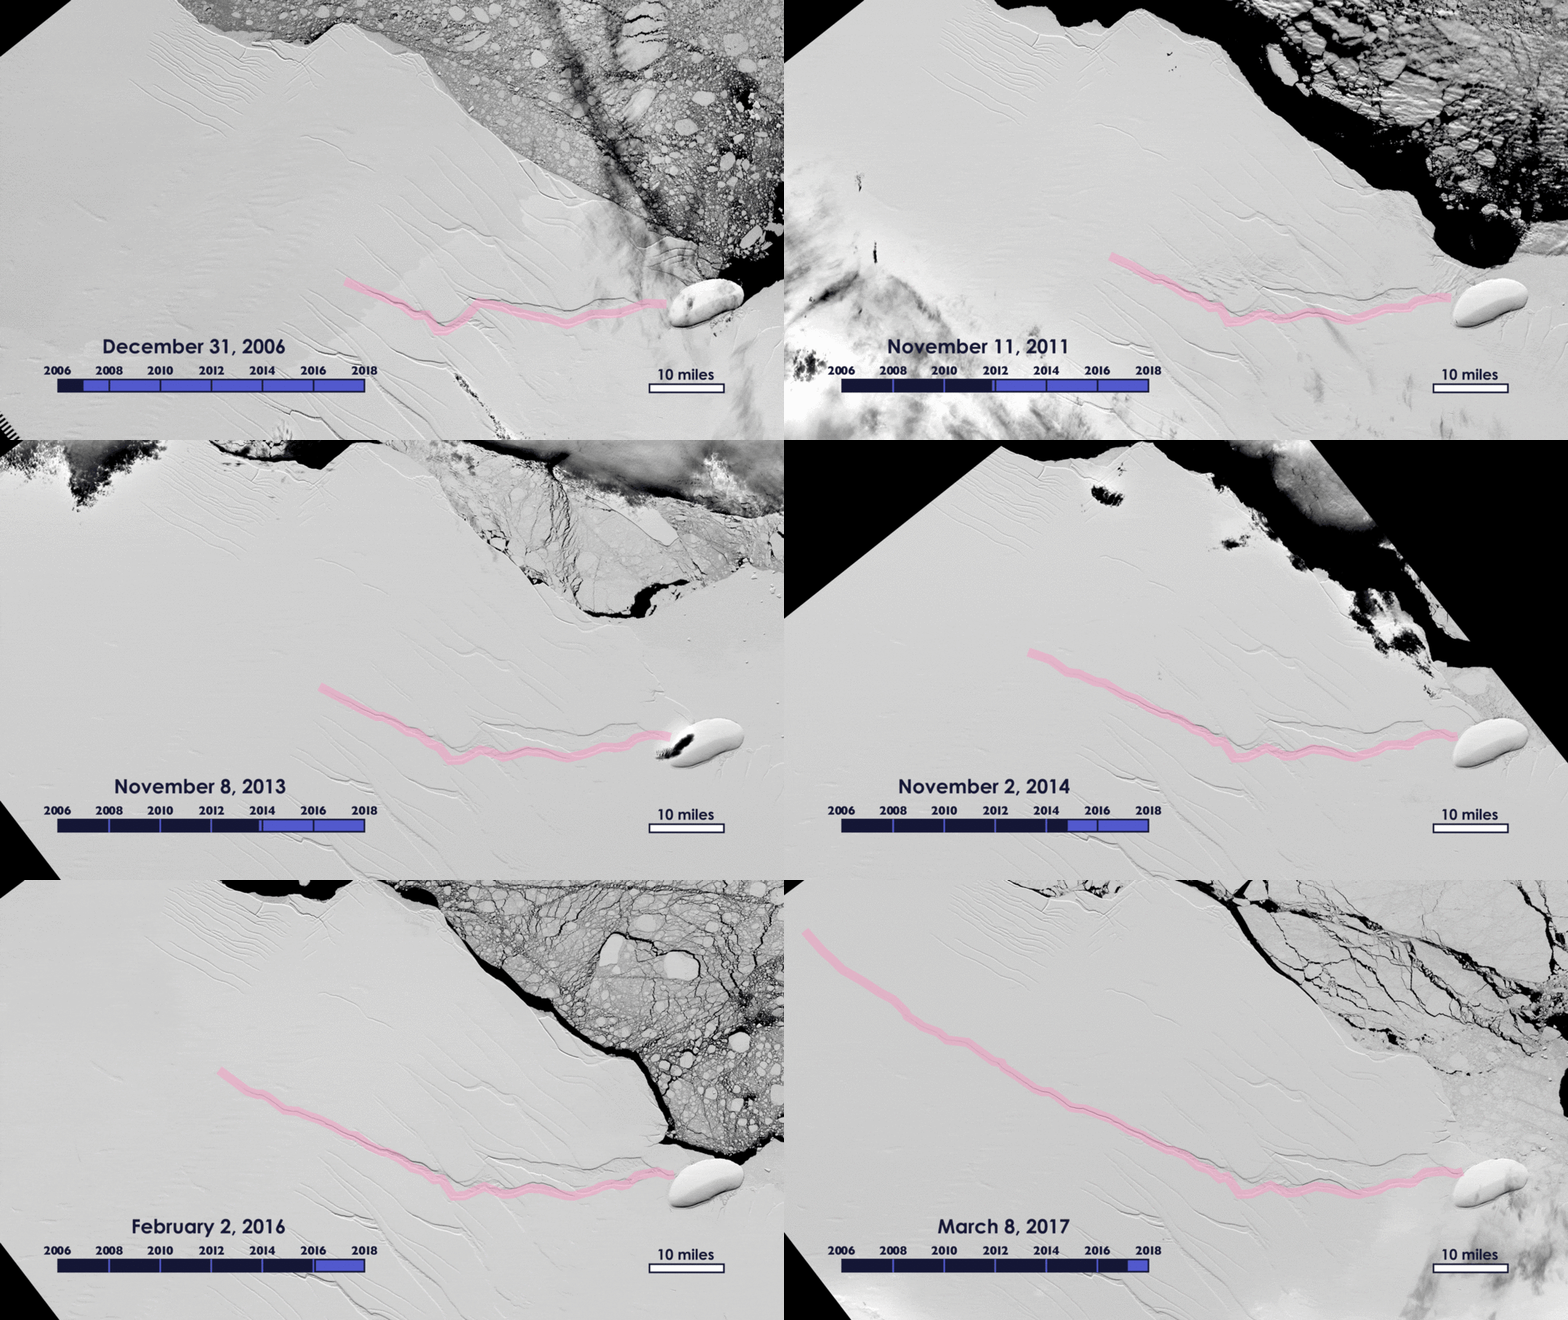
Now, images from NASA satellites show the iceberg's gradual separation from the ice shelf. The crack in the ice shelf that formed the iceberg was first observed in the early 1960s, but remained dormant for decades, according to a statement from NASA. The animation above includes images going back to 2006, collected by NASA and the United States Geologic Survey's Landsat satellites.
The rift in the ice shelf began to spread northward at a significant rate in 2014, and its progress accelerated in 2016, leading scientists to assume it would eventually create a separate iceberg. Between June 24 and 27, the speed of rift tripled, according to scientists with the Midas Project.
In November 2016, the rift was estimated to be about 300 feet (91 m) wide and 70 miles (112 km) long. Measurements from this summer put the rift at 124 miles (200 km) long.
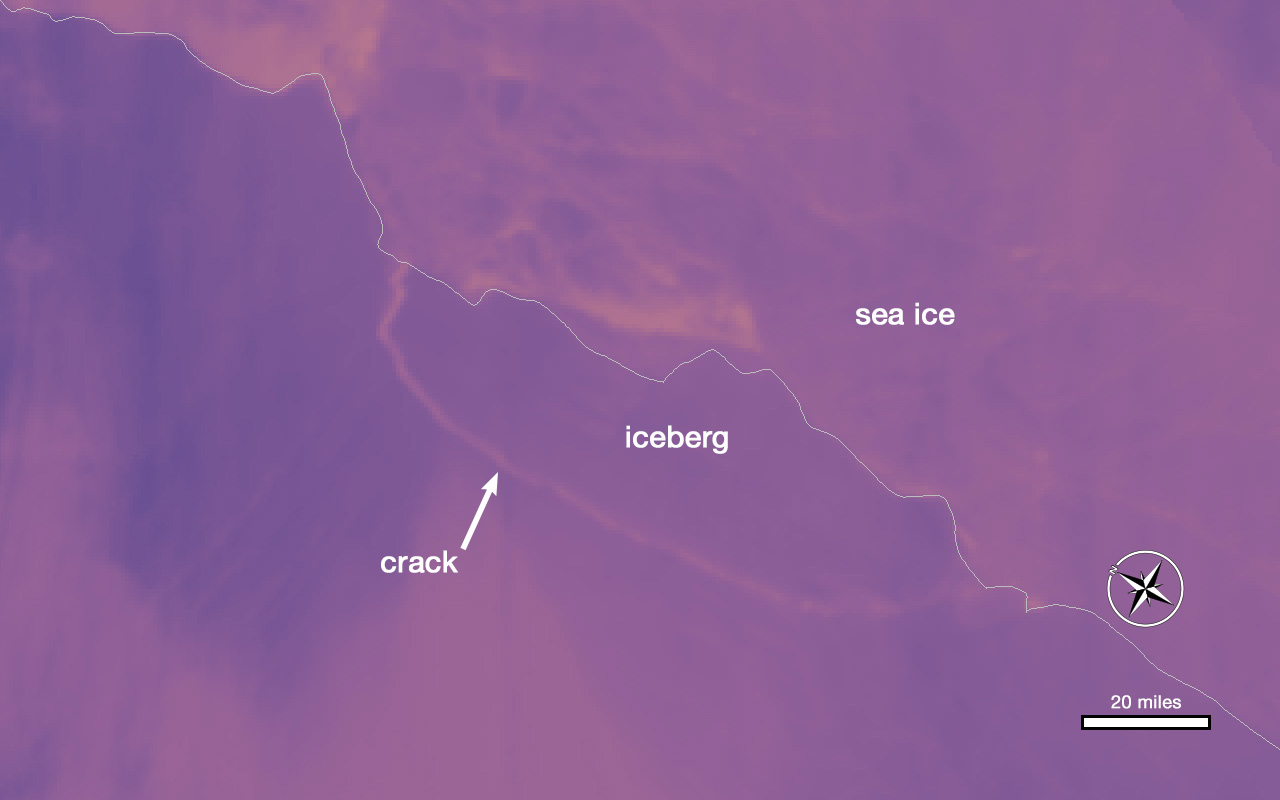
The MODIS instrument on NASA's Aqua satellite use thermal data to show temperature differences in the ice and seawater. In a false-color image taken today (July 12), the crack that created the iceberg is visible as a thin, pink line down the mostly purple ice sheet. The warmer temperature of the crack indicates that ocean water lies not far below the surface.
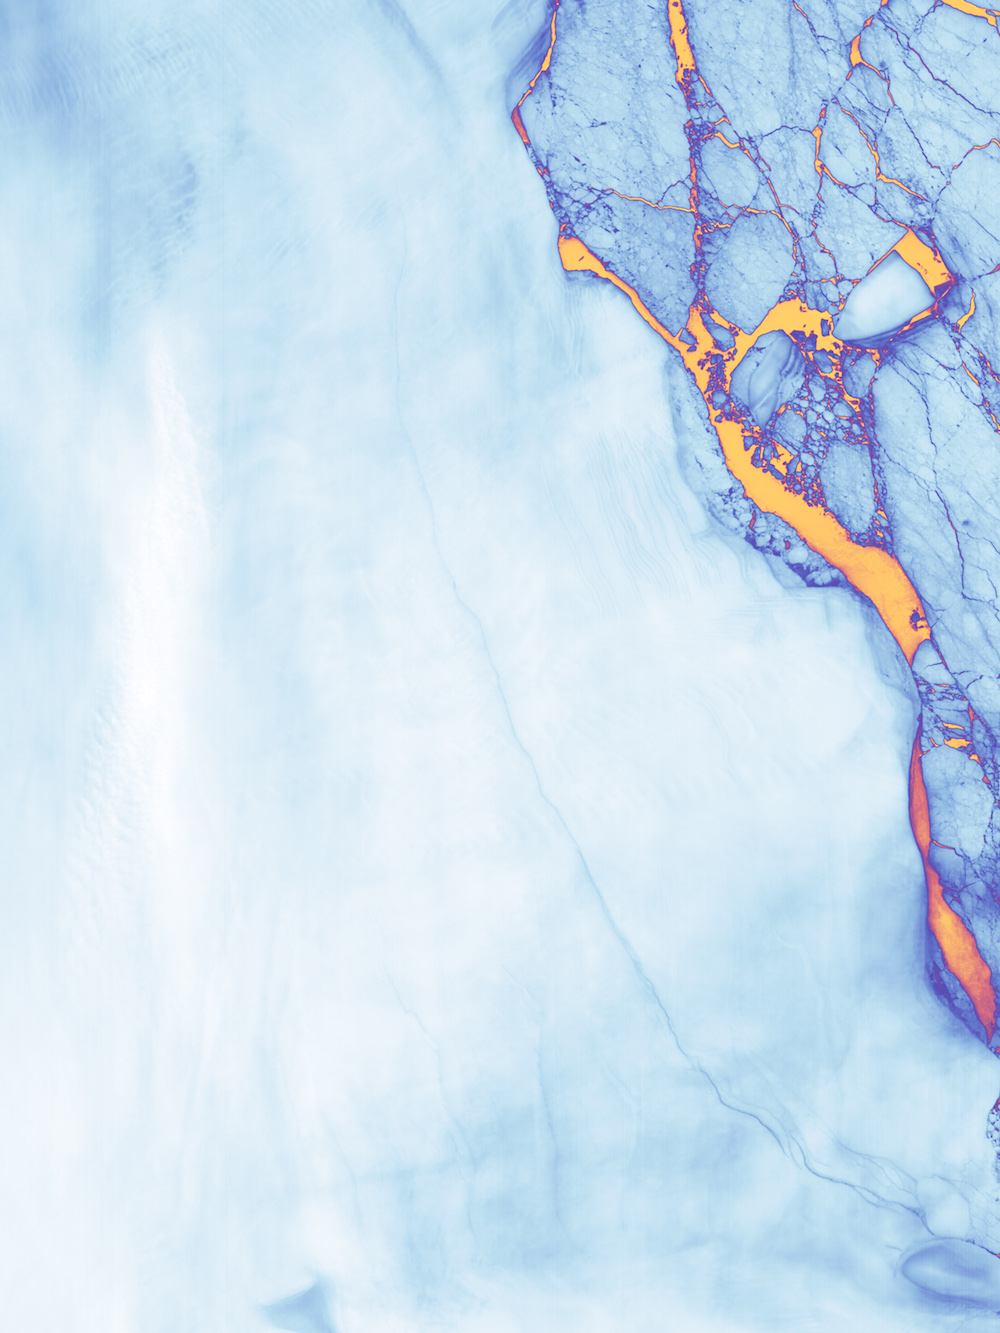
The Thermal Infrared Sensor (TIRS) on the Landsat 8 satellite also captured temperature data on June 17. The false-color image shows the slightly warmer crack (light blue) running through the very cold ice shelf (mostly white). The image shows warmer areas in orange, including regions of very thin sea ice. [Landsat: Four Decades of Images and Data]
Sign up for the Live Science daily newsletter now
Get the world’s most fascinating discoveries delivered straight to your inbox.
The Larsen C ice shelf is a floating ice shelf, which means the separation of the iceberg will not cause ocean levels to rise, unlike icebergs that calf from land-based ice shelves. Scientists with the Midas Project said they have not found evidence that the iceberg's formation was directly caused by climate change. However, the scientists said in a statement that this is the farthest back that the ice front has been in recorded history, and they are "going to be watching very carefully for signs that the rest of the shelf is becoming unstable."
Follow Calla Cofield @callacofield. Follow us @Spacedotcom, Facebook and Google+. Original article on Space.com.


