Health Stats: The Best and Worst States

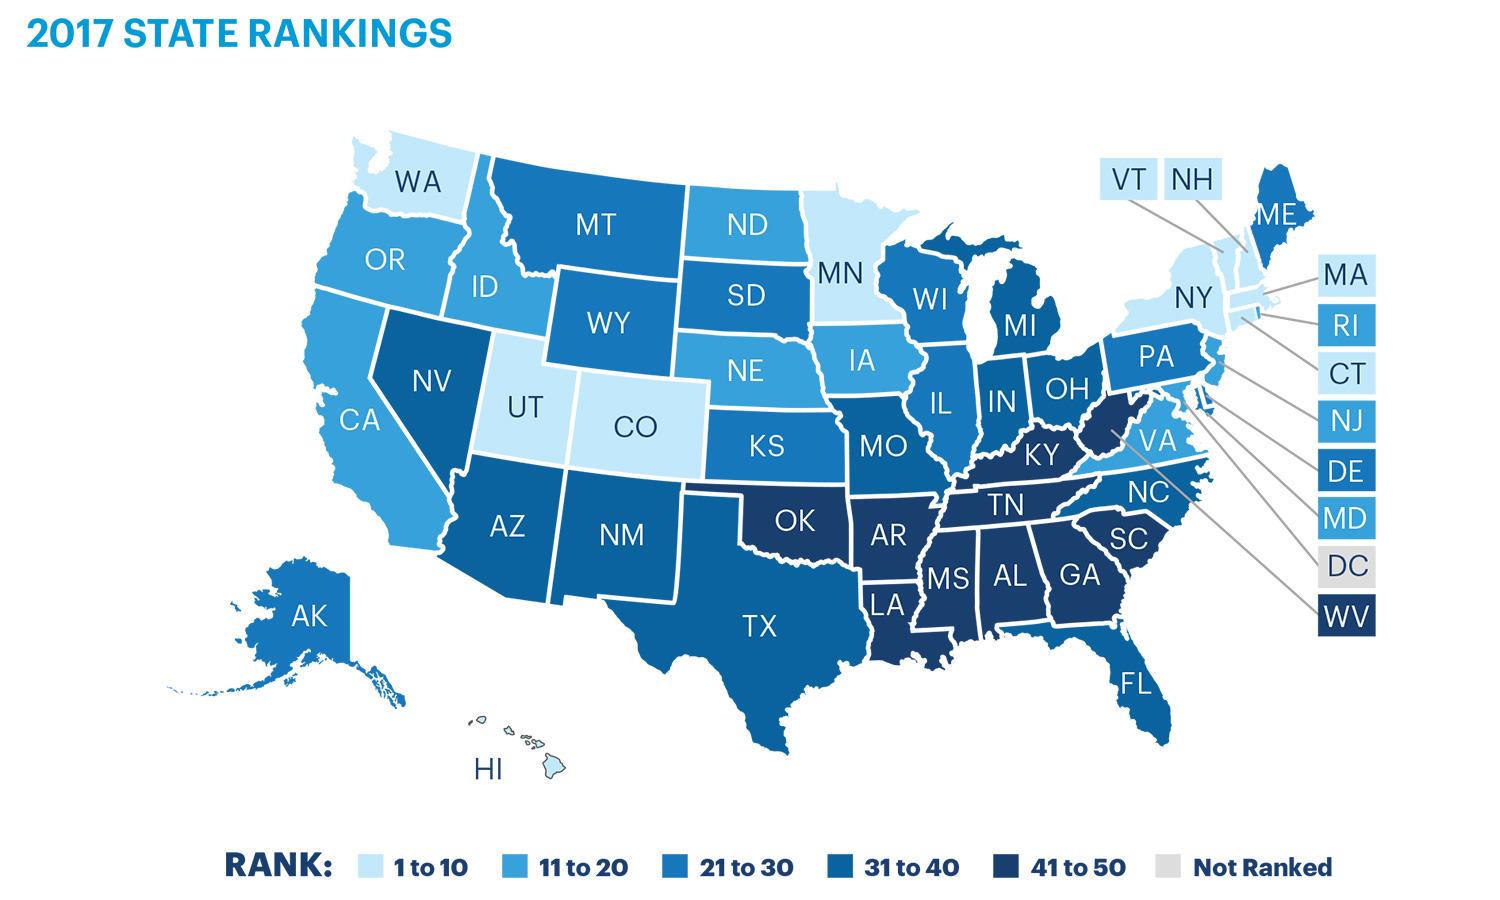
Massachusetts is the overall healthiest state in the union, according to the 2017 America's Health Rankings Report by the United Health Foundation. Mississippi is the least healthy. But on individual metrics, the states vary widely. Here are the highest- and lowest-ranking states for each of the 35 different measures of public health used in the report. [Full story: Massachusetts Unseats Hawaii As Healthiest State]
Drug deaths
Best: North Dakota, 5.7 deaths per 100,000 people
Worst: West Virginia, 55.3 deaths per 100,000 people
Excessive drinking
Best: West Virginia, 11.8 percent of adults
Worst: Wisconsin, 26 percent of adults
Four-year high school graduation rate
Best: Iowa, 90.8 percent
Worst: New Mexico, 68.6 percent
Obesity rate
Best: Colorado, 22.3 percent of the population with a body mass index over 30
Worst: West Virginia, 37.7 percent of the population with a body mass index over 30
Physical activity
Best: Utah, 15.7 percent of the population reports no physical activity
Worst: Arkansas, 32.5 percent of the population reports no physical activity
Smoking
Best: Utah, 8.8 percent of the population are current smokers
Worst: West Virginia, 24.8 percent of the population are current smokers
Best: Wyoming, 3.8 percent of the population is exposed to particulate matter sized 2.5 microns or less
Worst: California, 11.7 percent of the population is exposed to particulate matter sized 2.5 microns or less
Children in poverty
Best: New Hampshire, 7.6 percent of children living below the poverty threshold
Worst: Mississippi, 29.9 percent of children living below the poverty threshold
Infectious disease
Best: West Virginia, lowest incidence of chlamydia, pertussis and Salmonella combined
Worst: Louisiana, highest incidence of chlamydia, pertussis and Salmonella combined
Pertussis (whooping cough)
Best: Mississippi, 0.4 new cases per 100,000 people
Worst: Nebraska, 27.2 new cases per 100,000 people
Chlamydia
Best: New Hampshire, 233.3 new cases per 100,000 people
Worst: Alaska, 768.3 new cases per 100,000 people
Salmonella
Best: Maine, 9.3 new cases per 100,000 people
Worst: Mississippi, 35.7 new cases per 100,000 people
Occupational deaths
Best: New York, 2 deaths per 100,000 workers
Worst: Wyoming, 12.6 deaths per 100,000 workers
Violent crime
Best: Maine, 124 murders, rapes, robberies and aggravated assaults per 100,000 people
Worst: Alaska, 804 murders, rapes, robberies and aggravated assaults per 100,000 people
Immunization rates in adolescents
Best: Rhode Island
Worst: Mississippi
HPV immunization rate in females 13-17
Best: Rhode Island, 73 percent
Worst: South Carolina, 30.8 percent
HPV immunization rate in males 13-17
Best: Rhode Island, 68.7 percent
Worst: Wyoming, 19.9 percent
Meningococcal immunization rate in adolescents
Best: Rhode Island, 96.4 percent
Worst: Wyoming, 54.2 percent
Tdap (diphtheria, pertussis and tetanus) immunization rate in adolescents
Best: Massachusetts, 96.7 percent
Worst: South Carolina, 77.5 percent
Childhood immunization rate
Best: Massachusetts, 85.3 percent of children 19 to 35 months old have received recommended immunizations
Worst: Oregon, 58.1 percent of children 19 to 35 months old have received recommended immunizations
Public health funding (state and federal)
Best: West Virginia, $296 per person
Worst: Nevada, $41 per person
Uninsured rate
Best: Massachusetts, 2.7 percent of population uninsured
Worst: Texas, 16.9 percent uninsured
Concentration of Dentists
Best: Massachusetts, 80.7 dentists per 100,000 people
Worst: Arkansas, 41.2 dentists per 100,000 people
Concentration of mental-health providers
Best: Massachusetts, 547.3 providers per 100,000 people
Worst: Alabama, 85 providers per 100,000 people
Concentration of primary care physicians
Best: Rhode Island, 256.3 providers per 100,000 people
Worst: Idaho, 96.6 providers per 100,000 people
Low birth weight (infants weighing less than 5.5 pounds, 8 ounces at birth)
Best: Alaska, 5.8 percent of live births
Worst: Mississippi, 11.4 percent of live births
Preventable hospitalizations (discharges for conditions treatable in ambulatory care)
Best: Hawaii, 23.3 per 1,000 Medicare enrollees 65 and older
Worst: Kentucky, 76.6 per 1,000 Medicare enrollees 65 and older
Cancer deaths
Best: Utah, 150.5 per 100,000 people
Worst: Kentucky, 233.6 per 100,000 people
Cardiovascular deaths
Best: Minnesota, 189.7 per 100,000 people
Worst: Mississippi, 352.5 per 100,000 people
Diabetes
Best: Colorado, 6.6 percent of the population diagnosed with diabetes
Worst: West Virginia, 15 percent of the population diagnosed with diabetes
Disparity in health status
(Difference between the percentage of adults over age 25 with a high school education compared with those without a high school education who reported their health is very good or excellent)
Best: Alaska, 8.1 percent
Worst: California, 37.6 percent
Rate of frequent mental distress
Best: South Dakota, 8.3 percent of adults reporting poor mental health 14 or more days out of the past 30
Worst: West Virginia, 16.5 percent of adults reporting poor mental health 14 or more days out of the past 30
Rate of frequent physical distress
Best: North Dakota, 8.9 percent of adults reporting poor physical health 14 or more days out of the past 30
Worst: West Virginia, 18.2 percent of adults reporting poor physical health 14 or more days out of the past 30
Infant mortality
Best: New Hampshire, 4.2 infant deaths per 1,000 live births
Worst: Mississippi, 8.8 infant deaths per 1,000 live births
Premature death (years of life lost before age 75)
Best: Minnesota, 5,555 potential years lost per 100,000 people
Worst: Mississippi, 10,950 potential years lost per 100,000 people
Originally published on Live Science.
Sign up for the Live Science daily newsletter now
Get the world’s most fascinating discoveries delivered straight to your inbox.

Stephanie Pappas is a contributing writer for Live Science, covering topics ranging from geoscience to archaeology to the human brain and behavior. She was previously a senior writer for Live Science but is now a freelancer based in Denver, Colorado, and regularly contributes to Scientific American and The Monitor, the monthly magazine of the American Psychological Association. Stephanie received a bachelor's degree in psychology from the University of South Carolina and a graduate certificate in science communication from the University of California, Santa Cruz.


