Scary Map Shows Where Animal Poop Is Turning into Deadly Ammonia Pollution

It would seem that humans have underestimated the amount of poop their livestock are creating. Scientists know this because they can see it from space.
To be fair, it's not the actual animal poop they can see, but the ammonia being released by said poop. Ammonia (NH3) is a colorless waste gas that forms when nitrogen and hydrogen combine. It occurs in small amounts everywhere in nature, but is most commonly released when animals pee and poop. When lots of animal manure starts to decompose all at once — say, on a large industrial farm — the released ammonia can combine with other compounds to pollute the air, water and soil. Exposure to these polluted resources can lead to lung disease and death in humans as well as crop failure and mass animal death. [The 10 Most Polluted Places on Earth]
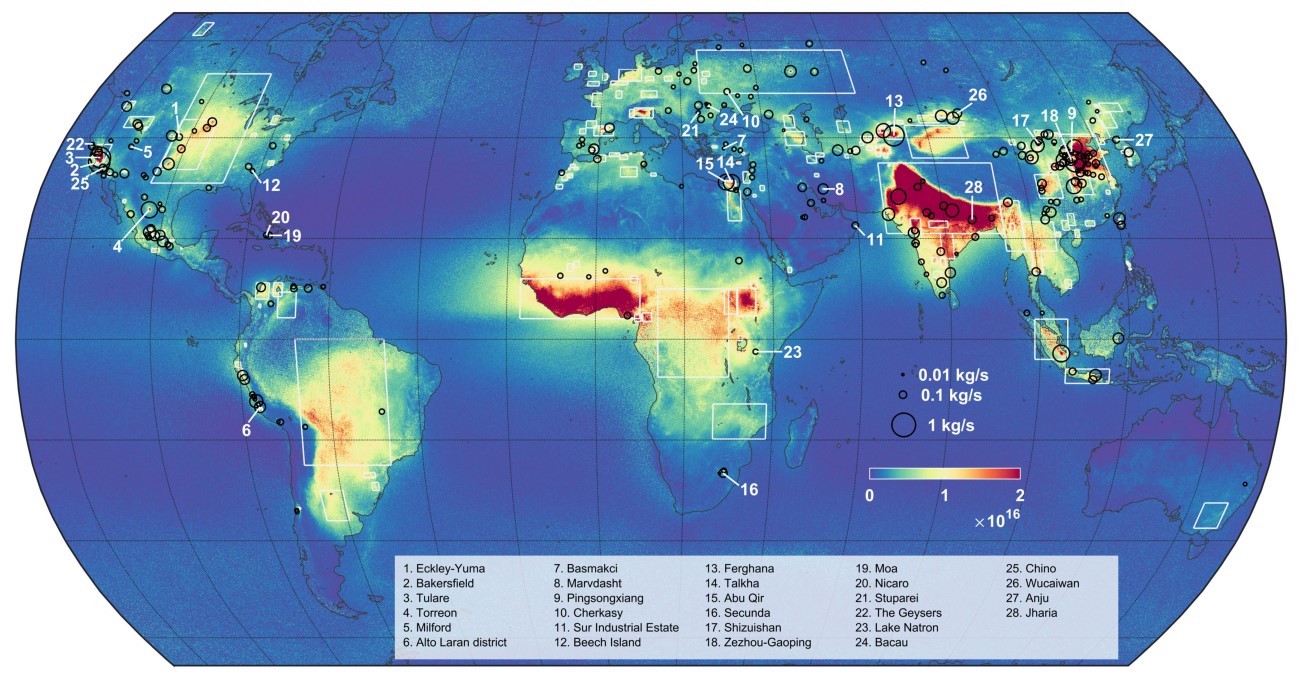
Tracking and regulating ammonia emissions can help prevent these avoidable hazards, but there isn't a very reliable way to do that on a global scale. With that in mind, a team of scientists led by researchers at Université Libre de Bruxelles (ULB) in Belgium combined nine years of satellite data to create the most comprehensive map of global atmospheric ammonia (and therefore animal poop) ever made.
The team's ammonia map, featured in a new study published today (Dec. 5) in the journal Nature, reveals more than 200 ammonia emission hotspots around the world, two-thirds of which have reportedly never been identified before.
"Our results suggest that it is necessary to completely revisit the emission inventories of anthropogenic ammonia sources and to account for the rapid evolution of such sources over time," the researchers wrote.
Who farted?
For their new study, the researchers averaged nine years of atmospheric data collected between 2007 and 2016 by the MetOp satellite mission — a series of three meteorological satellites launched by the European Space Agency to catalog the various components of our planet's atmosphere, including ammonia. This data revealed 242 ammonia "hotspots" (emission zones with a diameter of less than 31 miles, or 50 kilometers), as well as 178 wider emission zones.
The team used satellite imagery to confirm the sources of these ammonia hotspots and found that 241 of them were clearly linked to human activities. Of those, 83 were linked to intensive livestock farming and 158 were linked to other industries, mainly plants producing ammonia-based fertilizer. The single natural-ammonia hotspot was traced to Lake Natron in Tanzania, possibly caused by lots of algae and other matter decaying in the drying mud. Minerals flowing into the lake from the surrounding hills make the waters extremely alkaline, giving the lake a pH of up to 10.5 (ammonia, for comparison, has a pH of about 11).
Sign up for the Live Science daily newsletter now
Get the world’s most fascinating discoveries delivered straight to your inbox.
From their map, the authors found a few key takeaways. For starters, most of the world's ammonia hotspots are "unambiguously" tied to human activities. Looking solely at the changing atmospheric ammonia levels around the world, the researchers could spot the precise moments when farms and industrial plants opened, closed or expanded. An ammonia hotspot blooming over Xinjiang, China, in 2012, for example, coincides exactly with the opening of a fertilizer factory there.
More important, the map suggests that humans have been vastly underestimating the amount of ammonia our industries are releasing into the atmosphere. According to the researchers, two-thirds of the hotspots they found have not been previously reported in prior environmental surveys, while emissions from other hotspots have been significantly underreported. [8 Ways Air Pollution Can Harm Your Health]
While the team's satellite model has some limitations (it is difficult to calculate emissions in windy areas like mountains and coasts, for example), this study shows that satellite technology should be able to help nations be more honest with themselves about their ammonia footprint.
"Ammonia emissions in many countries are currently increasing, even in the European Union, which has committed to achieving an overall reduction of 6 percent by 2020 and 19 percent by 2030, compared with 2005 levels," Mark Sutton and Clare Howard, two researchers at the NERC Centre for Ecology & Hydrology in Edinburgh, Scotland, who were not involved in the study, wrote in a letter also published in Nature. "Combined with atmospheric models … satellite technology offers a valuable independent tool with which to check whether countries are really achieving their goals."
- Does It Fart? 10 Fascinating Facts About Animal Toots
- Earth from Above: 101 Stunning Images from Orbit
- 8 Ways Global Warming Is Already Changing the World
Originally published on Live Science.

Brandon is the space/physics editor at Live Science. His writing has appeared in The Washington Post, Reader's Digest, CBS.com, the Richard Dawkins Foundation website and other outlets. He holds a bachelor's degree in creative writing from the University of Arizona, with minors in journalism and media arts. He enjoys writing most about space, geoscience and the mysteries of the universe.


