2018 Was 4th Hottest Year on Record, NASA Finds
Last year was so hot that global land- and ocean-surface temperatures were 1.42 degrees Fahrenheit (0.79 degrees Celsius) above the 20th-century average, NOAA reported. Since 1880, when record-keeping began, only three years — 2016 (the highest, in part because of El Niño), 2015 and 2017 — were hotter.
"The key message is that the planet is warming," Gavin Schmidt, the director of NASA's Goddard Institute for Space Studies in New York City, told reporters at a news conference. "And our understanding of why those trends are occurring is also very robust. It's because of the greenhouse gases that we['ve] put into the atmosphere over the last 100 years." [6 Unexpected Effects of Climate Change]
The trend isn't a new one. Nine of the 10 warmest winters have happened since 2005, and five of the warmest years on record happened within the last five years, or from 2014 to 2018.
Moreover, NASA and NOAA double-checked their work against the findings of other groups, including the United Kingdom's Met Office and the World Meteorological Organization, which also ranked 2018 as the fourth warmest year on record.
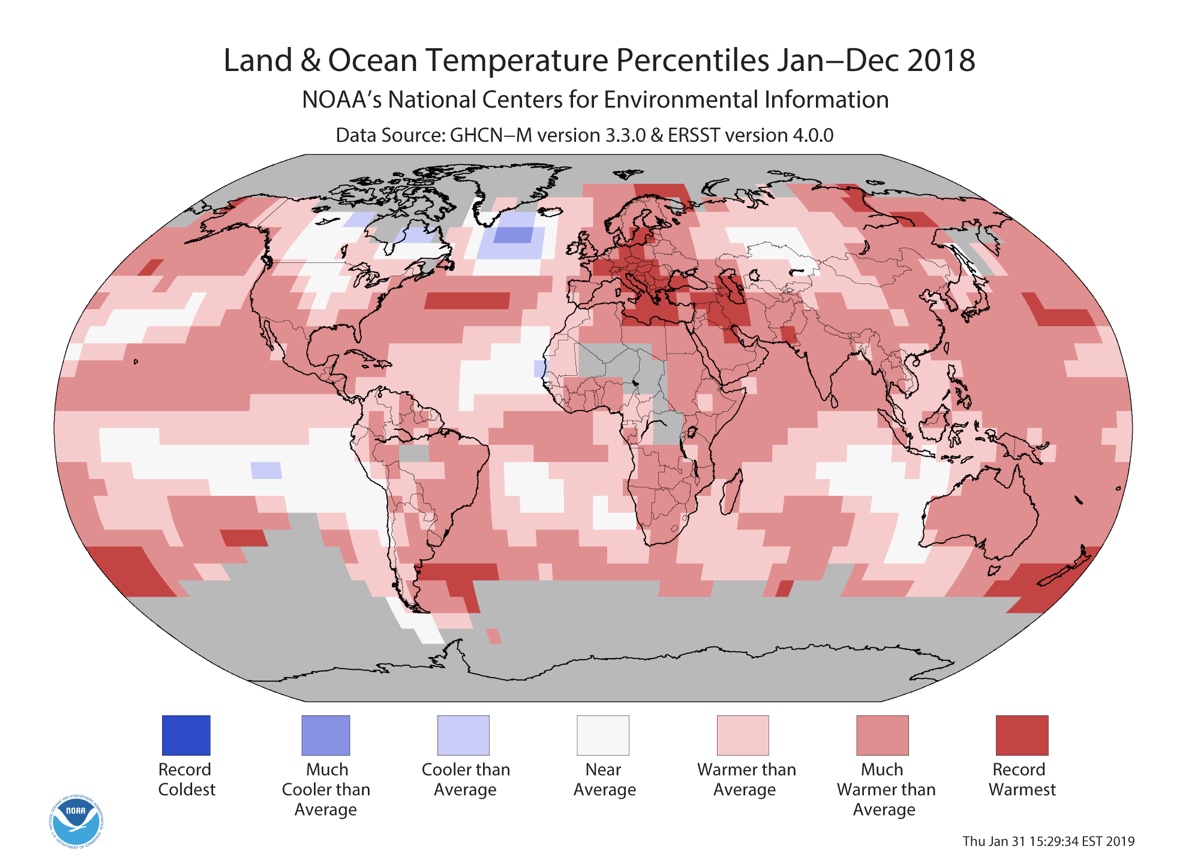
There was record warmth (land and ocean temperatures) in much of Europe, the Mediterranean, the Middle East, New Zealand and Russia, as well as in parts of the Atlantic and western Pacific oceans, Deke Arndt, chief of the monitoring section at NOAA's National Centers for Environmental Information in Asheville, North Carolina, told reporters.
But it wasn't sizzling everywhere. "The interior part of northern North America was on the cool side of recent history, particularly the prairie provinces of Canada," Arndt said. That explains, in part, why 2018 was only among the top 20 warmest years for North America, he said.
Overall, the world over, both land and seas were hotter than average: The land was about 2.02 F (1.12 C) and the oceans were 1.19 F (0.66 C) warmer than the 20th-century average, NOAA found.
Sign up for the Live Science daily newsletter now
Get the world’s most fascinating discoveries delivered straight to your inbox.
The area most impacted by climate change is the Arctic, which is warming between two and three times faster than the global average, Schmidt said.
"We obviously are very concerned with what's going on in the Arctic," Schmidt said. "We have a large decrease in Arctic sea ice, particularly in the summer and in September, which is the minimum sea-ice period in the Arctic. But there are also decreases in the winter as well, but they are less pronounced."
U.S. climate
In the United States, 2018 was the 14th warmest of the 124 years on record, at least for the contiguous 48 lower states, Arndt noted. It was about 1.5 F (0.83 C) warmer than the 20th-century average. As you can see in the map below, the dark red areas had the warmest years on record; the orange areas had temperatures in the top 10 percent of their history; and areas with light orange had temperatures that were in the warmest third of their history, Arndt said.
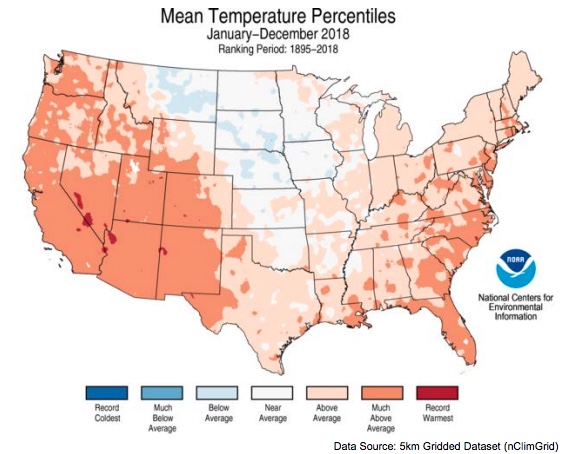
Last year was also the third wettest year in the U.S. on record, Arndt said. Hawaii even set a record for the rainiest 24-hour period in U.S. history, when it rained 49.69 inches (126 centimeters) in Kauai from April 14–15, 2018. [The Weirdest Things That Fell From the Sky]
Meanwhile, severe drought lingered in the Four Corners region of the American Southwest. While this area has experienced drought in the past, climate change has made these droughts more intense, largely because the soil dries out more due to increasing temperatures, Schmidt said.
Extreme climate events have also taken a toll on the U.S. economy. There were 14 weather- and climate-related events that cost more than $1 billion in 2018, making it the fourth largest total on record since 1980. (The scientists adjusted for inflation, Arndt noted.) In total, these events, including hurricanes Florence and Michael, as well as the wildfires out West, cost $91 billion in direct losses, Arndt said.
Double-checking data
Climate scientists have taken many precautions to expel uncertainties from their data. For instance, they factored in whether methodologies had changed over the years, Schmidt said. What's more, to avoid bias due to the so-called "urban heat island" effect, in which cities are warmer than surrounding areas, the agencies collect most of their data from rural areas; and if a station moves or the environment around it changes, scientists control for that, too, Schmidt said.
In addition, NASA satellites have been tracking climate data since 1979, which also serves as an outside check on data collected on Earth. These satellites show an indication that "the Arctic is warming more in the real world, according to satellite trends, than we are capturing in the station-based analysis," Schmidt said.
- Images of Melt: Earth's Vanishing Ice
- 8 Ways Global Warming Is Already Changing the World
- The Reality of Climate Change: 10 Myths Busted
Originally published on Live Science.

Laura is the archaeology and Life's Little Mysteries editor at Live Science. She also reports on general science, including paleontology. Her work has appeared in The New York Times, Scholastic, Popular Science and Spectrum, a site on autism research. She has won multiple awards from the Society of Professional Journalists and the Washington Newspaper Publishers Association for her reporting at a weekly newspaper near Seattle. Laura holds a bachelor's degree in English literature and psychology from Washington University in St. Louis and a master's degree in science writing from NYU.
