Scientists reveal the hidden math that governs how neurons cluster in the brain
In humans and several other mammals, brain cells are distributed according to a fundamental mathematical pattern, which could help researchers make better models of the brain in the future.

The density of neurons in the brain is governed by a fundamental mathematical function, new research finds.
The discovery, which holds true across a variety of mammals, could help researchers make better computer models of the brain in the future.
"This distribution allows us to look at this in a statistical way and could help to find the relationship between neuron densities and the connectivity in the brain," study co-author Aitor Morales-Gregorio, a researcher at the German scientific institute Forschungszentrum Jülich.
Morales-Gregorio and his colleague Alexander van Meegen, a postdoctoral researcher at Harvard University, led the new study, which was published in July in the journal Cerebral Cortex. During their attempts to build models of the brain, van Meegan told Live Science, the team realized scientists knew little about what dictated the density of neurons in the brain. While previous work had compared densities from species to species or from some layers of the cortex — the outer, wrinkly part of the brain — there was little information about how the density of nerve cells might vary within cortical regions.
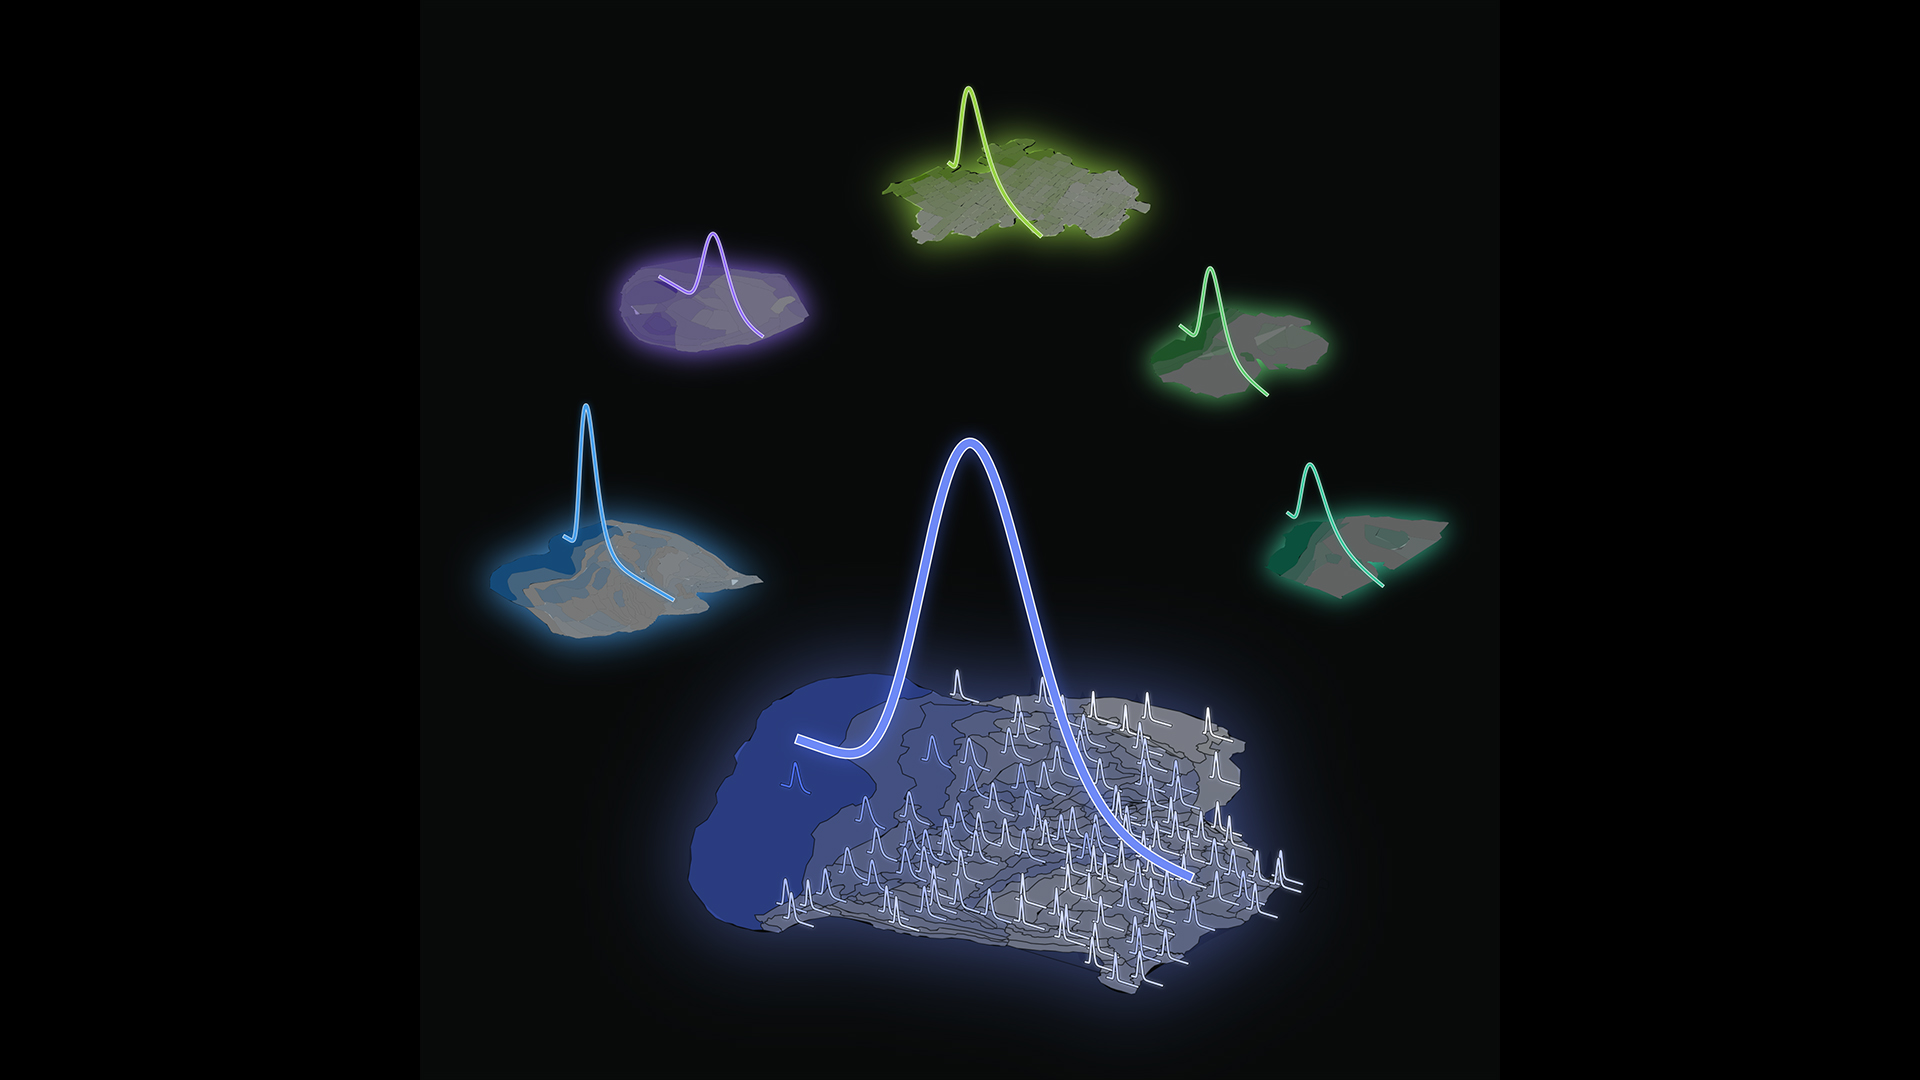
The researchers combined previously collected data from mice, marmosets, macaques, humans, galagos (also known as bush babies), owl monkeys and baboons. They found that neurons were distributed in a common pattern across all of these mammals: Within different cortical regions, the density could be described with a lognormal distribution.
On a graph, a lognormal distribution is skewed to one side, with a long tail tapering off to the right. What this represents, van Meegen said, is that there are a lot of regions with average neuron densities, but a few regions have much higher density. And those higher density regions may be important, because they represent rare but important deviations from the norm.
"If we only look at the mean number of neurons, maybe one doesn't see the difference," van Meegen said. But the long-tailed distribution means that a few changes to extreme outliers in density might make a big difference in brain connectivity or even function.
Sign up for the Live Science daily newsletter now
Get the world’s most fascinating discoveries delivered straight to your inbox.

The researchers also investigated why this pattern might hold across very different mammals. They found that given the way neurons arise — by cells dividing in a somewhat variable environment — the lognormal distribution arises naturally, without any need for regulatory processes.
"It may originate from how the brain comes to be, by cells splitting over and over with a little bit of noise, possibly from internal variability or changes in the environment," or variability in the environment, Morales-Gregorio said. "This probably explains why it's everywhere."
The researchers are now looking at how this pattern of distribution affects how neurons communicate with one another, and whether disruptions in the pattern might lead to neurological problems.

Stephanie Pappas is a contributing writer for Live Science, covering topics ranging from geoscience to archaeology to the human brain and behavior. She was previously a senior writer for Live Science but is now a freelancer based in Denver, Colorado, and regularly contributes to Scientific American and The Monitor, the monthly magazine of the American Psychological Association. Stephanie received a bachelor's degree in psychology from the University of South Carolina and a graduate certificate in science communication from the University of California, Santa Cruz.


