
-
 How Scientists Created a Semi-Artificial Life Form (Infographic)
By editing its DNA sequence on a computer, scientists modified a eukaryotic yeast cell.
genetics -
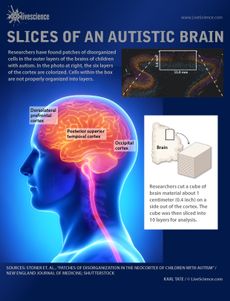 New Research Finds Cell Damage in Autistic Brain (Infographic)
Patches of cells in the outer layer of the cortex are disorganized in the brains of autistic children.
health -
 The Mystery of Missing Flight 370 (Infographic)
More than two weeks after its strange disappearance, Malaysian officials announced they believe Flight 370 crashed into the sea.
planet-earth -
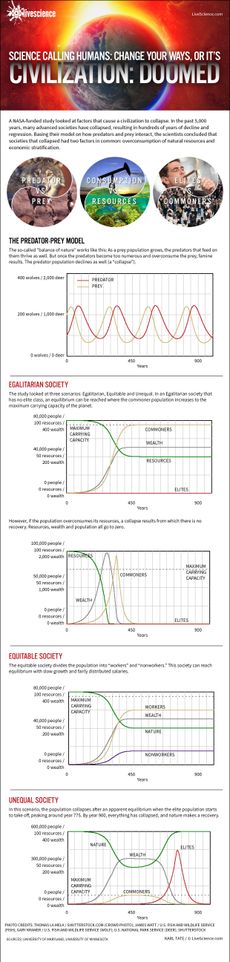 Study: Civilization Doomed by Overconsumption, Wealth Inequality (Infographic)
Advanced societies frequently collapse unless steps are taken to regulate resource consumption and economic stratification.
human-behavior -
 Nutrition Facts Label: Proposed FDA Changes (Infographic)
The U.S. Food and Drug Administration wants to update the labeling on food packages to reflect the latest thinking on diet and nutrition.
food-drink -
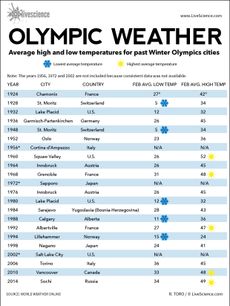 Olympics: Warmest and Coolest Years on Record (Infographic)
Chart shows average high and low temperatures of Olympics sites since 1924.
climate-change -
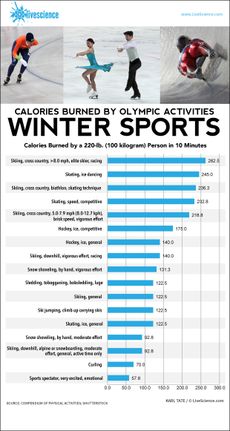 Calories Burned by Winter Sports Activities (Infographic)
Relative number of calories expended during 10 minutes of various Olympic activities.
health -
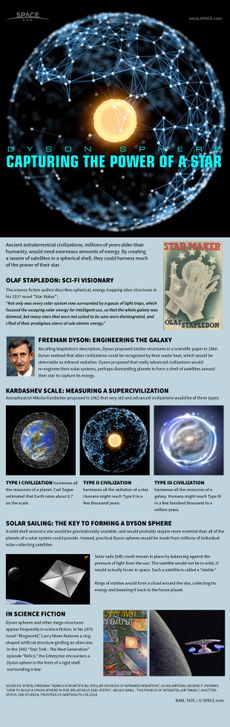 Dyson Spheres: How Advanced Alien Civilizations Would Conquer the Galaxy (Infographic)
By surrounding their star with swarms of energy-collecting satellites, advanced civilizations could create Dyson spheres.
extraterrestrial-life -
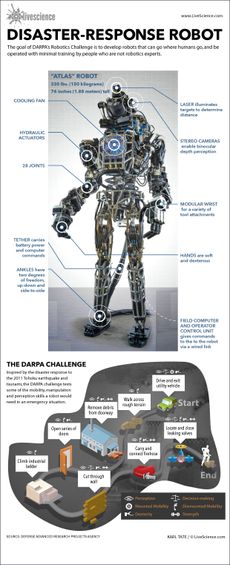 How DARPA's Robotics Challenge Works (Infographic)
The Challenge is a series of tasks to test the capabilities of robots designed for disaster response in emergencies.
robotics


